

XRP is under pressure. When Bitcoin crashed below the $60,000 minimum, Ripple token collapsed right alongside it, sliding all the way to the bottom. $1.08 After briefly falling below $1.05. The psychological level of $1 – once a distant safety net – is now staring traders in the face.
How did XRP collapse to $1?
This wasn’t an XRP-specific crash, it was guilt by association. $XRP has a long, well-documented history of amplifying Bitcoin’s moves to the downside. In each major Bitcoin decline this year, XRP has lost nearly twice as much as Bitcoin, with the ratio holding steady at about 1.8 to 1.
So when the price of Bitcoin fell below $60,000, XRP had no chance to survive. The setting here is arguably uglier than the last great influx. Bitcoin breaking below $60,000 for the first time since October 2024 — after the strategy broke its years-long never-sell rule and spot bitcoin ETFs ended its longest string of outflows ever — created worse conditions than the Iran War implosion in February, when buyers intervened at the now-broken $1.11 level.
The main support that bulls have been defending all year has finally fallen. XRP had been holding $1.28 – a level that buyers have defended on every dip since February – for about a week, before falling sharply with a break of $1.11 and closing the $1 lower limit.
XRP Price Analysis: Is Buying XRP Risky?
The daily chart paints a clear bearish picture. Since it tops out near $1.50 In the resistance zone in mid-May, XRP was locked inside a clean downtrend line – a consistent sequence of lower highs and lower lows that capped each rebound attempt.
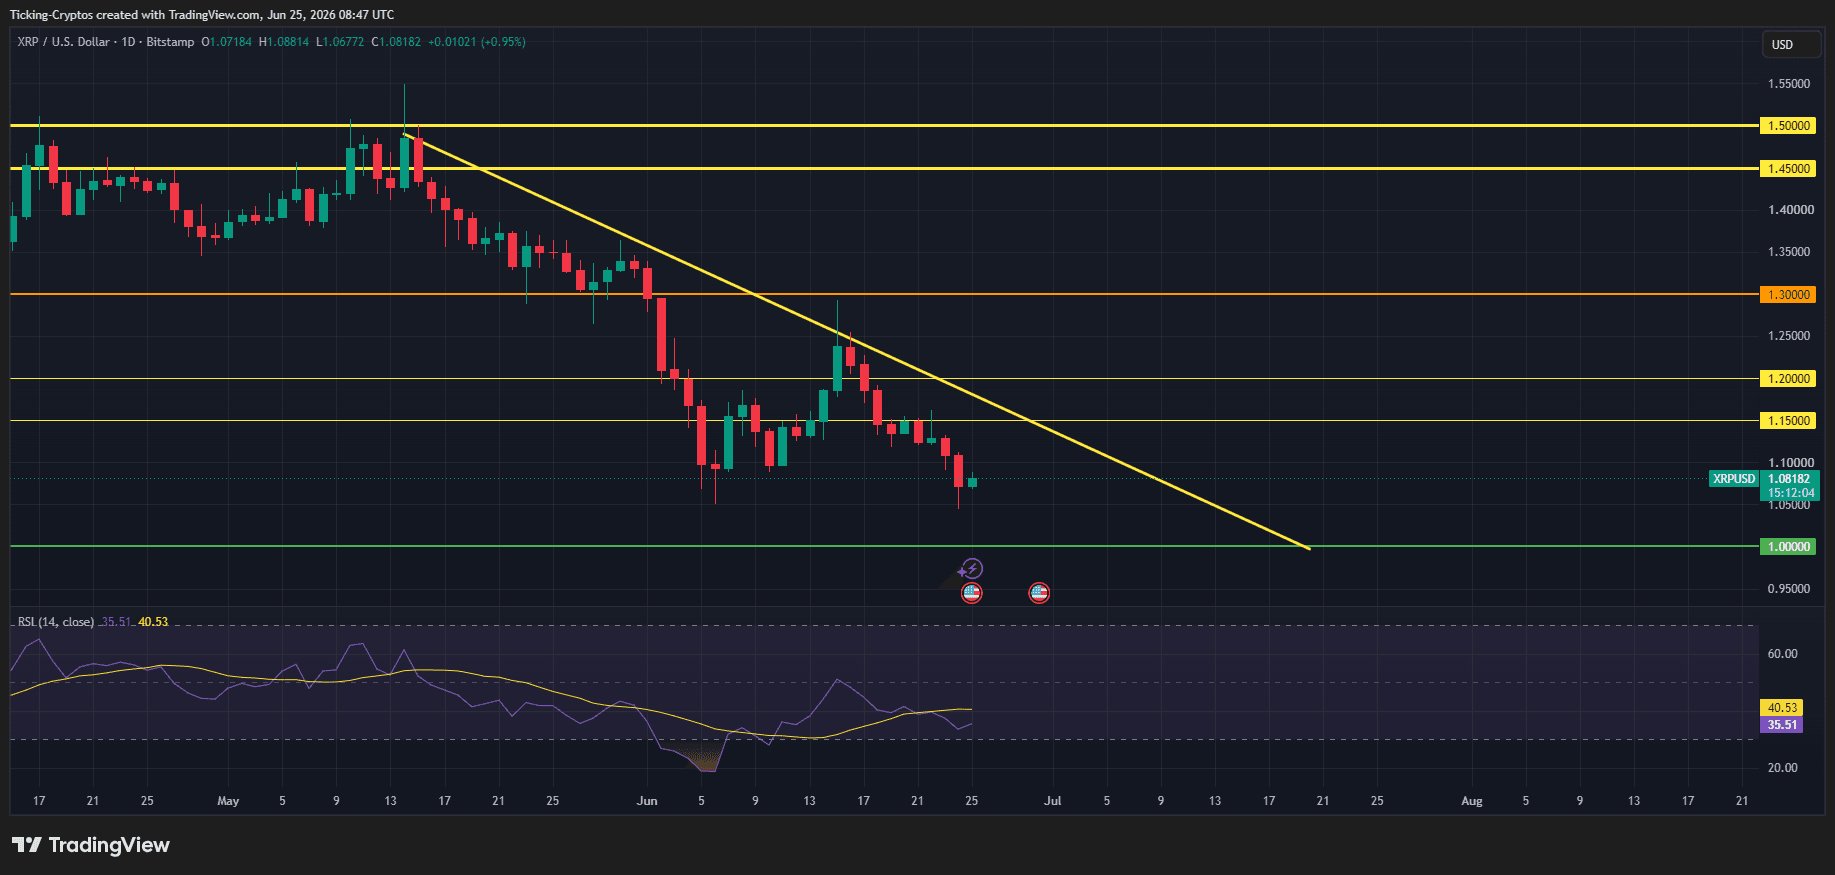
Key technical takeaways:
- The downtrend is intact. Every rally since mid-May has been sold off at the downward yellow trend line. The mid-June rebound towards the $1.30 level failed completely there before falling back again.
- Broken support turned into resistance. The $1.15 and $1.20 levels that previously served as support have flipped into overhead resistance. XRP now trades under both.
- The $1.00 line is the last position. The green support line is located at the $1.00 psychological level. This is the level to which the entire chart is now gravitating.
- The RSI is at 40.53. Momentum is bearish but not deeply oversold on the daily chart. An RSI near 40 means there is still room to fall before sellers are completely sold out – a warning sign for anyone expecting an immediate bounce.
The structure is clear: until XRP can reclaim the downtrend line and flip $1.15 back to support, the path of least resistance points to the downside.
XRP Price Prediction: Where will Ripple go next?
Here’s where it gets interesting. The near-term picture hinges almost entirely on two things – Bitcoin and the law of clarity.
- Bearish case (downside to $1 and below). With a break of $1.05, the chart is weak. Analysts identify $1.13 as important weekly support for XRP, noting that a confirmed break below could highlight the $0.90-$1 target zone, citing Bitcoin weakness as a major hurdle. The worst-case macro scenarios are even uglier — if Bitcoin drops below $60,000 while ETF decisions stall and regulatory progress stalls, some forecasts suggest XRP could stabilize between $0.21 and $0.75. This is a tail risk, not a base case, but it shows how damaging a prolonged Bitcoin collapse can be.
- Bullish condition (violent rebound). This is the development that makes XRP great right now. While the price is bleeding, the on-chain data tells the opposite story. XRP whales now control 45.83 billion tokens – 68.5% of the circulating supply, the highest concentration since May 2018 – and Binance whales’ outflow dominance recently reached 91.4%, the same reading that preceded XRP’s surge from $0.50 to over $3 in late 2024. Moreover, the positioning is extremely unbalanced: shorts currently outpace longs by about 9 to 1, meaning that any sudden positive catalyst — such as a vote in the Senate — could trigger a short squeeze that moves XRP much faster than fundamentals alone would suggest.
- The law of clarity is allowance. This is the biggest swing factor. If the bill is settled and the macro economy stabilizes, Standard Chartered expects the price of XRP to reach $2.80, with analysts’ bullish range extending towards $8 – but only if the Clarity Act is passed. Stalls and slips Until 2030 or later, prices may fall to approximately $0.53. This represents a ~30-40% downside versus a 2.5x-7x upside, which is exactly why XRP holders are holding on to this vote.
Levels that matter
For you Ripple price Forecast watchlist, keep it on the radar:
- Instant support: $1.05, then the most important thing $1.00 Psychological ground.
- If $1 breaks: The $0.90 area comes into play, with a bit of technical support underneath.
- Restoring the uptrend: XRP needs to break back above the downtrend line and turn around $1.15 To support until the repair of the structure begins. Above that, $1.20 and $1.30 are the next hurdle.
XRP Price Prediction: Will XRP Collapse Below $1?
The collapse of XRP to $1 isn’t Ripple’s problem — it’s Bitcoin’s problem, which is exacerbated by XRP’s tendency to fall roughly twofold with every drop in BTC. The daily chart is strongly bearish, the downtrend line remains dominant, and the $1.00 line is the last meaningful support before things get very weak.
But the setup is a coil spring. With whales accumulating, shorts seriously crowded, and a vote on the CLARITY Act looming as a binary catalyst, XRP could see an explosive move in… also direction. For now, respect the downtrend – but don’t be surprised if a single headline violently flips this chart.


