
Listen to the audio version of this article (generated by artificial intelligence).
The Iranian peace agreement excites the markets… The hidden signal in gold’s rise… What broke the gold market… The structural condition that did not move… And a tool for knowing when to act… Watch today’s cryptocurrency miners
As I write on Monday, investment markets are rising on yesterday’s news that the United States and Iran have announced an initial peace deal aimed at ending nearly four months of conflict.
The memorandum of understanding has been completed. Both sides retreated militarily. Crucially, the Strait of Hormuz – which transports nearly a fifth of the world’s oil and liquefied natural gas in normal times – is set to reopen on Friday, when the agreement is formally signed in Geneva.
Markets do not wait for Friday..
As I write this article, the three major US stock indexes are up more than 1%, with the Nasdaq leading the way, up about 3%. Meanwhile, West Texas Intermediate (WTIC) crude fell 5% to $80 a barrel, its lowest level in more than three months. Treasury yields fall. And the dollar is falling.
Today’s reading is clear and straightforward: war premiums have been abolished, and risk has entered. This framework is not wrong. Reopening Hormuz means lower energy prices, lower inflation expectations, and the Fed has more breathing room.
But a note of caution is warranted. The deal has not yet been signed, Israel is not a party to it, and the core issues – the Iranian nuclear program, sanctions, and regional security – are being pushed into a sixty-day negotiating window. So the risk of a return to conflict during the summer remains.
However, to this day, the markets celebrate. And for good reason – this is really big news.
Now, while most investors are returning to AI trading, there is another setup that looks even more attractive today…
gold.
It’s up about 3.5% as I write, and the reasons behind the move tell a more interesting story than the one everyone is talking about.
Why gold is rising – and why it matters more than you think
For months, the Iranian conflict has been kryptonite for near-term gold.
This logic was counterintuitive but true: higher oil prices push up inflation expectations, which pushes Treasury yields higher and supports the dollar – and gold, which does not yield any yield, loses its relative attractiveness in that environment.
Higher long-term interest rates have been weighing on the metal even as the fundamental turmoil that is gold’s real driver continues to build beneath the surface.
Today, this dynamic is being reversed at once, as traders look forward to the reopening of the Strait of Hormuz.
Oil is falling. Inflation expectations fall. The odds of an interest rate hike are declining. And the dollar is weakening. Essentially, all of the short-term headwinds for gold turn into tailwinds in one session.
Meanwhile, the structural forces that drove gold’s historic rise – financial deterioration, dollar depreciation, and central bank accumulation – have not moved an inch. These forces operate on a decade-long schedule and have not been affected by the Iranian conflict.
So, today’s gold movement is not just a peace deal. The market has begun to reprice the yellow metal without the artificial weight of interest rate concerns weighing on it. This is a different and more permanent story than what most investors are currently focusing on.
To understand where gold goes from here, you need to understand what broke its record in January — and why the damage may be closer to being over than most people think.
The warning signs were there
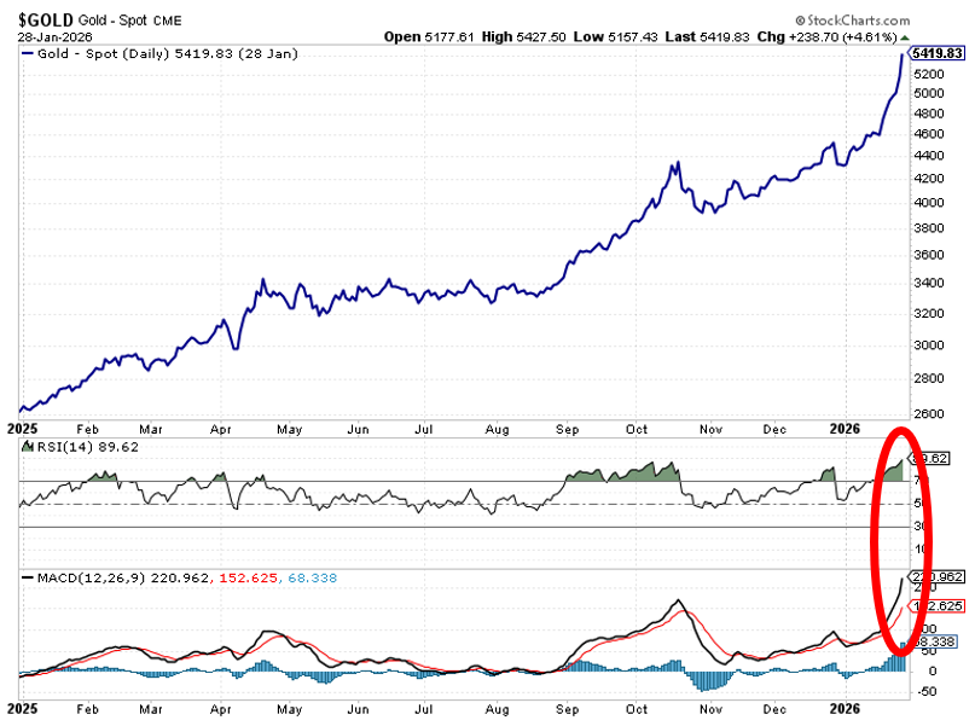
From an all-time high of around $5,600 on January 29, the yellow metal fell to around $4,200 before today’s bounce – a roughly 25% drop.
For an asset that was supposed to benefit from inflation, geopolitical turmoil and financial turmoil, this is a disturbing outcome.
Why did you fall so hard?
First, gold’s rally from mid-2025 through late January 2026 was exceptional — the metal nearly doubled in about a year, its best annual performance since 1979. By the time it reached $5,600, two technical indicators closely watched by traders were flashing bright red.
The first is the RSI – the relative strength index – which measures whether an asset has been bought very aggressively over a short period. Readings above 70 indicate “overbought” territory. As I’ll show you below, at gold’s peak in January, the RSI was around 90.
The second is the MACD – the moving average convergence/divergence indicator – which tracks the momentum behind price action. At its January peak, it reached its highest level in more than a decade, indicating that the movement was beginning to lose steam.
Any technical trader looking at gold in late January would have told you that a correction was coming. The questions were what would lead to such a move, and how deep would be the correction that would follow.
The match that lit the fuse
Two things happened at once on January 30 – and this combination of a natural decline turned into a historic collapse.
The first was President Donald Trump’s announcement that Kevin Warsh would become the next Chairman of the Federal Reserve, which sent shockwaves through the price market.
Warsh is widely viewed as an inflation hawk. Markets immediately repriced the interest rate path: instead of cuts in 2026, talk suddenly turned towards a higher rate for a longer period.
At the same time, Treasury yields rose. The dollar strengthened. Gold, which does not generate any returns and competes directly with interest-earning assets, lost its relative appeal almost overnight.
The second reason is less well-known – and frankly, it’s a detail that most financial media has completely ignored.
Forced rebalancing of the index.
Think of the major commodity index like a pie. Each component – oil, copper, gold and silver – is supposed to represent a specific segment. When gold nearly doubled in one year, its tranche grew much larger than the rules allowed.
Large index funds that follow these standards simply cannot allow this to happen. They are required to sell gold futures contracts to reduce the gold tranche to its target size.
This is not because they want to, or because they have lost confidence in gold or its fundamentals. It’s just because of the rules – like the thermostat turning off when the room gets too warm.
Therefore, when Wersh’s nomination arrived on the same day, this forced mechanical sale was already underway; The two waves hit simultaneously, meaning that what looked like a decisive victory from the gold bears was, in large part, just a perfect storm of mechanisms colliding with historically overbought assets.
The case did not move
Our global expert Eric Fry, editor Fry investment reportframed the long-term case for gold when he made a gold recommendation to subscribers last year, borrowing a line from financial writer James Grant:
Gold is betting on monetary chaos, but also on other types of chaos, including financial, geopolitical, and presidential turmoil.
Today, despite gold’s decline, none of the four disruptions identified by Grant have dissipated.
Central banks bought a net 244 tons of gold in the first quarter of 2026 alone. The US national debt grows by nearly a trillion dollars every quarter. The share of the dollar in global reserves has also declined for two decades.
The market was pricing in an inflation shock in Iran. The decade-long thesis has not been priced.
Today’s peace agreement does not resolve these structural disorders; it simply removes the short-term headwinds that have been pushing them against them. These are two very different things – and this distinction is exactly why today’s gold action deserves more attention than it gets.
Another look at the gold chart – but updated
A moment ago I showed you what the technical indicators looked like at the January high: the RSI is pushing the 90 level, the MACD is extending to the extreme, and it is an asset that is poised to decline.
Technically, we are in the opposite position today. See for yourself…
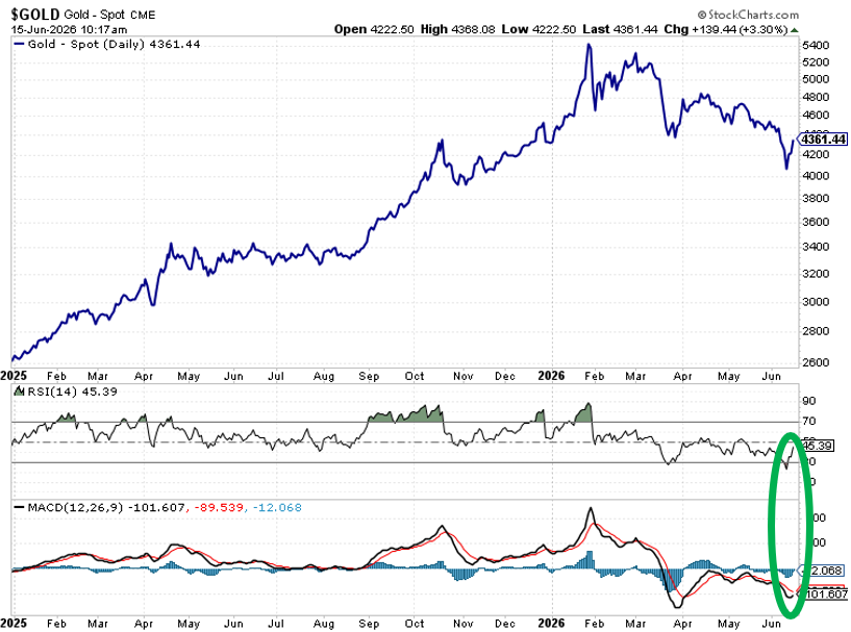
Recently, the RSI briefly touched the high 20s – officially oversold – and is now rising, already back to the 45 level.
Meanwhile, the MACD is very negative but has just turned north and is moving back towards the signal line – an upward move.
So, the same indicators that screamed “overbought” at $5,600 and were signaling “oversold” just days ago at $4,200, are now signaling “buying opportunity with room to run” with gold approaching $4,400 today.
To be clear, this is not a guarantee that gold will go straight up from here. Again, the agreement has not yet been signed, and the situation in Iran remains highly uncertain. But the technical and fundamental images are now pointing in the same direction for the first time since January.
Which raises the most practical question in this whole matter digest…
Fundamentals tell you what to have, but timing tells you when to act
The structural case is that gold is worth owning at these levels for investors with a longer-term time frame. Today’s total turnaround removes the strongest near-term headwinds the metal has faced all year from a technical perspective.
But “technically things look better” is not the same as “now is the right moment.” How does an investor move from analysis to acting with data rather than gut feeling?
This is the exact problem faced by legendary investor Louis Navellier, ed Growth investorand the TradeSmith team spent the past year solving problems together.
If you missed our coverage last week, Lewis has spent 47 years identifying companies with real fundamental strength — and so does he Stock grader It is the quantitative system he built to record that process.
What the collaboration with our friends at TradeSmith has added is a timing layer: an accurate, data-driven signal when fundamentals are strong enough to act on.
The output is simple – traffic light. Green means the fundamentals are strong and the technical timing is right. Yellow means contract. Red means stay out or go out.
Here’s Lewis:
While the main focus of my Stock Grader program is which stocks to buy, TradeSmith’s Short-Term Health program is about when to buy them.
I have been looking for edges in this market for 47 years. I’ve never seen one like this.
Linking to gold is easy..
The fundamental case for owning gold right now is strong – it is down 20% from its highs, with structural forces remaining intact and short-term technical indicators flashing green.
But knowing the basic condition/technique and knowing the right moment to pull the trigger are two different skills. Lewis and Treadsmith built a system for exactly that second skill.
One last corner of the market that deserves your attention today…
Bitcoin mining stocks are having a banner year, with the tracking basket rising more than 50% in 2026 even as Bitcoin itself collapses. It is rising today as investors return to the market.
How would this happen if Bitcoin collapsed?
Because Bitcoin miners were shifting from selling retail to selling power, positioning themselves as the owners of building artificial intelligence.
As veteran trader Jonathan Rose said, it’s the same substation, same transformer — just a different tenant.
The fact is that Wall Street today values the megawatts of power used to power AI chips at many times higher than the same megawatts used to power Bitcoin mining equipment.
Therefore, companies making this shift from “speculative retail factory” to “critical AI infrastructure” are being rebranded in real time. This creates tremendous momentum in the relevant stocks.
Jonathan will break down six mining stocks at the center of his $90 billion AI pivot tomorrow Masters in Trading Live episode.
In this free Live videos from MIT, he gives insight into market trends, explains entries and exits, and discusses opportunities he sees in real time. It does this every day the market is open at 11 a.m. Eastern time. You can subscribe here.
Bottom line: If the mining-to-AI pivot is new to you, Tomorrow’s video is the place to start – Jonathan will walk you through where you’re going from here and how much runway these stocks still have.
Coming full circle
The January gold bull market is not over. It was reset by a hawkish Fed surprise, a sell-off in mechanical indicators, and an oil shock that temporarily made inflation a bigger story of chaos.
Today’s peace agreement removes the biggest of those headwinds. But the decade-long forces that drove gold’s bull run — financial deterioration, dollar depreciation, and central bank accumulation — haven’t moved an inch.
Invest accordingly.
I wish you a good evening,
Jeff Remsburg


