
Review SOL/USDT 1D chart

🔍 What’s going on here?
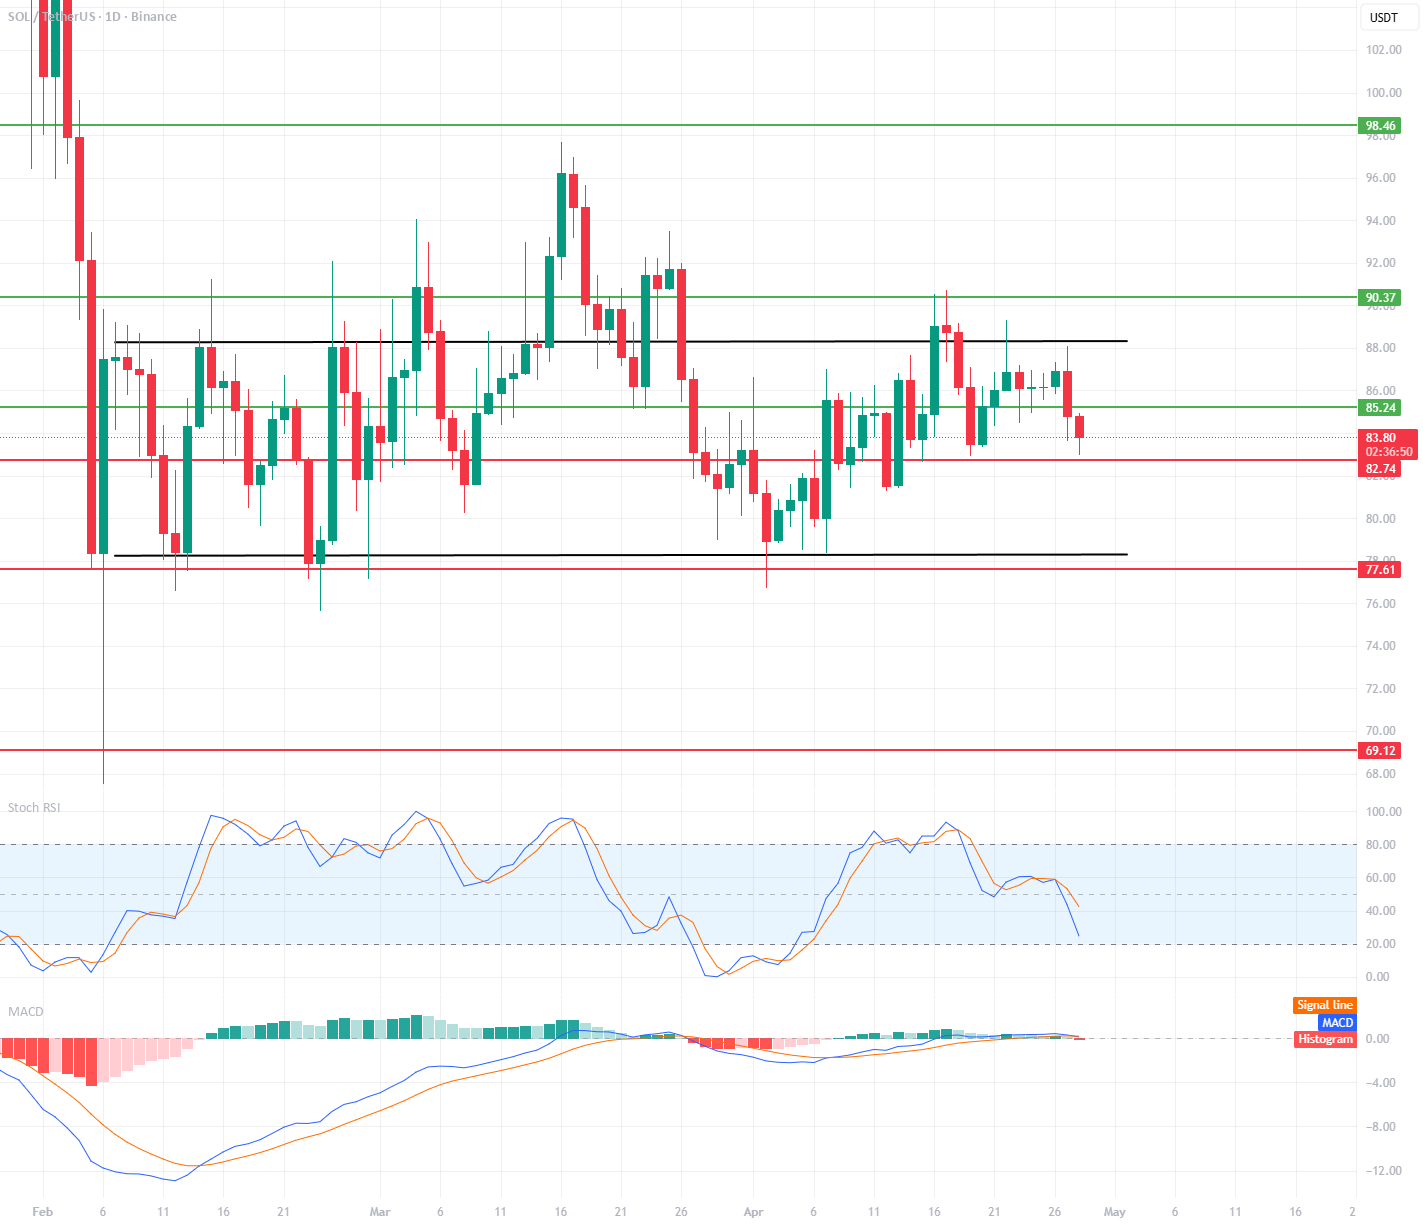
📦 1. Scope (the most important)
You have a very clear scope:
🔴Support: ~77.6
⚫ Medium range: ~88–89
🟢 Resistance: ~90.3 – 98.5
The price has been bouncing between these levels for a while now.
👉 We are now closer to the middle of the range → just below it
Meaning: There is no long or short benefit
📉 2. Current situation (here and now)
Price ~ 83
Rejection of about 88-89 (medium resistance)
A lower high is formed (bearish signal)
👉 This suggests:
Short-term downside advantage
📊 3. Indicators
Stoch Relative Strength Indicator:
Down from the overbought zone
Momentum is declining
👉 Bearish in the short term
MACD:
Double chart
The lines flatten
👉 No trend strength = continued consolidation
⚠️ Main scenarios
🟥 Scenario 1 – Rollback (most likely now)
If we lose:
82-83
👉 Goal:
80
77.6 (Main Support)
🟩 Scenario 2 – Rebound
If he defends:
82
👉 Possible return:
85 → 88
but:
Until it goes beyond 90+, it’s just a range.
🚀 Scenario 3 – Hack (Game Changer)
Only after hacking:
🔼 Above 90.3 ← Long trend
🔽 Less than 77.6 → Strong discharge


