
Nvidia analysis
Nvidia company Bat: NVDA

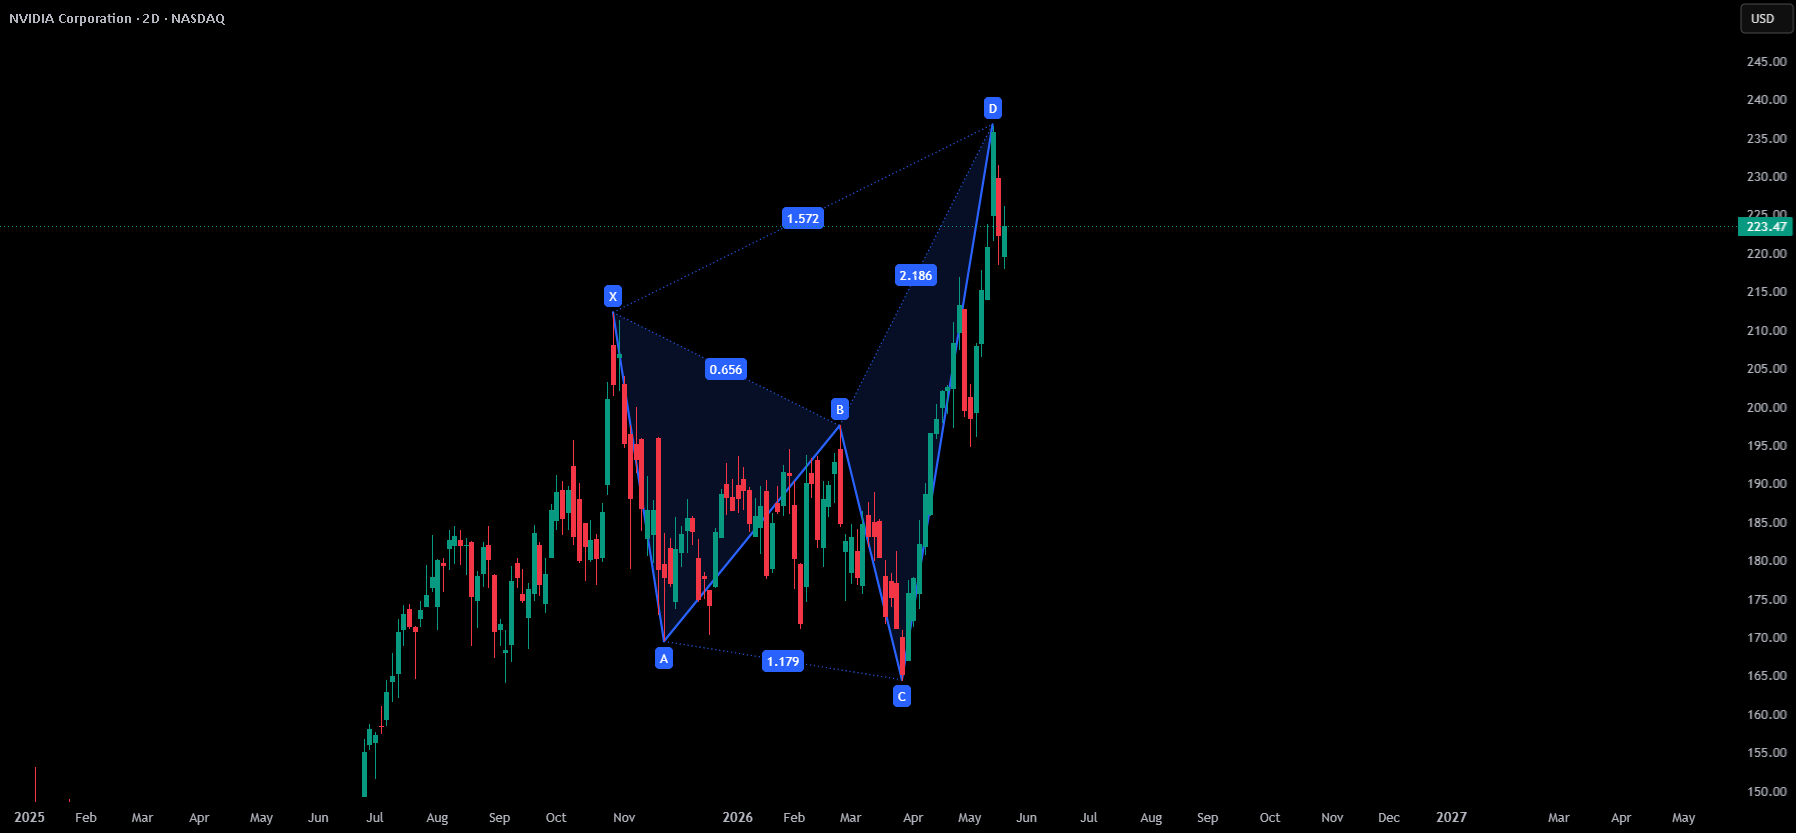
We have a completed bearish Nen Star harmonic pattern. The structure has drawn a strong sell signal at the recent high, indicating a possible trend reversal. Downside targets are clearly defined and offer a strong risk-reward profile: TP1 at 210.95 (1.27R), TP2 at 195.14 (2.06R), and TP3 extended lower at 164.27 (3.6R).
Visually, the setup looks incredibly clean, but traders need to be careful
Note: This evaluation is based entirely on structural technical analysis and engineering charting principles. Market dynamics are fluid, and technical models represent probabilities, not guarantees. Pattern setups can fail, so this must be balanced with broader market conditions and strict risk management.


