

- Ethereum price resilience above the $2,345 support level suggests a potential 7.85% upside, before buyers challenge key channel resistance.
- Blockchain tracking firm Arkham Intelligence flagged a prominent whale transferring nearly 3,000 Ethereum to centralized exchanges in two separate transfers on May 5.
- Deribit’s Ethereum options market currently reflects a weak outlook for significant volatility across most contracts extending through late July.
ETH, the native cryptocurrency of smart contract giant Ethereum, rose 1.5% during the US market session on Tuesday to trade at $2,382. The rally follows broader market momentum as Bitcoin regained the psychological level of $80,000 amid the crisis Reducing tension In the Middle East. Despite the price rise, Ethereum faces the risk of renewed selling pressure as on-chain data led to a prominent whale taking big profits.
This activity coincides with a notable shift in the ETH options market that anticipates future negative extreme values and implied ATM volatility of multiple expirations. Additionally, a notable discount in long-term ETH futures signals weak buyer conviction, reinforcing the narrative of a temporary rally before the next crash.
Ethereum Whale cashes in as ETH rises
blockchain analytics platform, Arkham Intelligencerecently highlighted a notable profit taking trade from a prominent whale portfolio, 0x237B…FB6aAb. The wallet owner transferred approximately 3,000 ETH in two different transactions on May 5, transferring approximately 2,000 coins to an OKX deposit address and another 1,000 to Binance for a total value of $7.15 million at today’s prices.
This coincided with a slight increase in the price of Ethereum that day, registering a rise from $2,350 to $2,390. It is not clear whether the price action precipitated the decision or was merely a coincidence with the decision, but the portfolio’s history suggests a measured approach rather than reactive selling.
Over the life of the wallet – since its first recorded transaction on December 30, 2022 – the operator has experienced a series of buying and selling cycles. The broader pattern shows a wave of heavy outflows in late March 2026, a pause, and then a return of new buying activity in early April and again at the beginning of May. The latest sell-off was preceded by an accumulation window that opened around April 11 and lasted about three weeks before dissolving.
The numbers tell the real story: an average entry of around $2,580 versus an average exit of around $3,020, resulting in approximately 72.98 million realized gains. With approximately 94% of the position now liquidated, whoever controls this portfolio has extracted the bulk of its profits and appears to be in the final stages of completely closing this particular trading cycle.

Historically, whale selling has often coincided with a local top or renewed corrective trend, indicating a potential decline in the price of Ethereum.
Deribit’s options point to a calm future, with one near-term exception
the Options market in Ethereum It sends a mixed signal, depending on where you are on the calendar. In a series of contracts extending from late May through the end of July, futures implied volatility and implied volatility were below expected levels — a sign that traders trading those windows are not hedging against a significant amount of movement.
The short-term outlook is different. The May 6th expiration is unique with higher implied volatility at the money and skewness in the direction of calls. Anyone trading this contract is either hedging against an overnight spike, or making a directional bet that something will move before the end of the day tomorrow. The market becomes silent after that date.

The ETH futures curve is showing cracks before the June expiration
The June 26 Ethereum futures contract at ETHUSD_260626 is trading below the spot price, and the basis is compressed to 1.913. When you are in a market where futures contracts are typically priced higher than current prices, flipping or tightening of the relationship becomes noticeable.
Long-term traders are not paying forward exposure which historically represents a slowdown in directional enthusiasm, but not actual panic. The end of June is so far away that putting it there would represent considered opinions rather than reactive hedging.
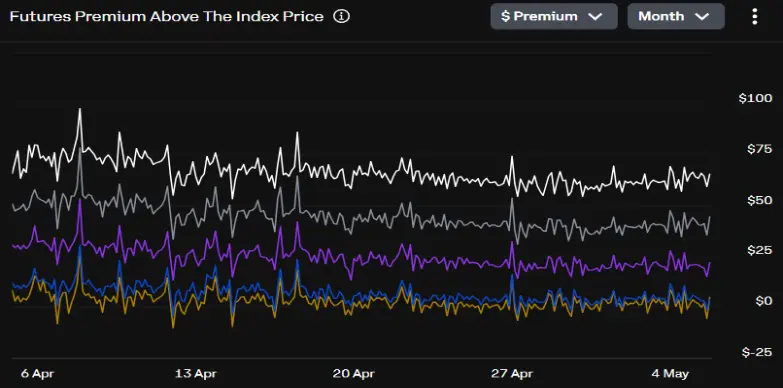
The compressed basis sits alongside the softer implied volatility readings seen across longer-dated Derrbit options, painting a consistent picture of muted conviction heading into summer.
Ethereum price is leading a steady recovery within a channel pattern
In the past three months, Ethereum price It showed a slow but steady recovery above the $1,800 support level. Interestingly, the price rise resonated strictly within two parallel trend lines, indicating the formation of an ascending channel pattern.
The chart setup provides dynamic resistance and support for the price, causing the trend to accelerate. Amid the recent rebound, Ethereum price has retraced its 20- and 50-day EMA, fueling a renewed recovery in the market.
It is currently trading at $2,371 per Ethereum Ethereum0.70% The coin is just 7.65% away from challenging the pattern’s resistance trend line at $2,533. The fluctuation of the 200-day EMA slope near this resistance creates a strong resistance area for buyers.
Therefore, a potential breakout would have a greater impact on the price, fueling a stray recovery to $3,045, followed by a jump towards $3,400.
However, a deeper analysis of ETH’s technical chart shows a significant decline in trading volume despite the price recovery. This indicates poor persuasion or less interest from traders in committing to a buy/long position in the market.
Therefore, the Ethereum price faces the risk of renewed selling pressure at channel resistance. If sellers continue to defend the upper trend line it will rebound and prolong this slow recovery.

Under a pessimistic condition, Ethereum price may break the lower trend line of the pattern. With continued selling, a post-breakout decline could pull the asset back ~19% from the breakout point to retest the support at $1,750.

