

Ethereum fails to hold $2,000 as Bitcoin declines
The cryptocurrency market is witnessing a sharp intraday correction on June 2, 2026. Ethereum ($ETH) has officially breached the critical $2,000 psychological support areareaching an intraday low near $1,963. This overall cut follows a systemic bleeding led by Bitcoin (BTC), which fell below the $70,000 final threshold for the first time in nearly two months.
The bearish momentum accelerated during early European trading hours, triggering automated stop losses and liquidation of derivatives across major digital asset exchanges such as Bitstamp and Binance.
Why is the cryptocurrency market collapsing today?
The driving force behind Ethereum’s sudden decline is entirely related to the negative structural shift in Bitcoin’s price movement. The leading cryptocurrency faced dual headwinds that crushed buyer sentiment over the past 24 hours:
- Flash token sale strategy: MicroStrategy (branded simply as Strategy) unveiled its first US dollar Bitcoin liquidation since late 2022. The company’s treasury sold $2.5 million worth of BTC to satisfy preferred shareholder dividends. Although the nominal amount is small, the breach in Michael Saylor’s strict “HODL” game rules greatly alarmed market participants.
- Huge ETF Outflows: According to institutional data collected BloombergUS-based Bitcoin ETFs are currently seeing a record 11-day string of net capital outflows, with investors withdrawing nearly $3.5 billion from fund instruments amid heightened geopolitical tensions between the US and Iran.
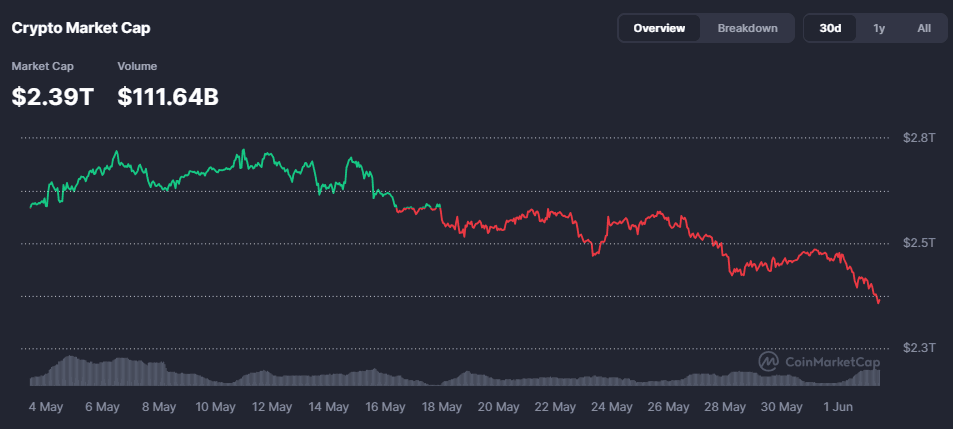
As capital has forcefully exited Bitcoin, the broader altcoin landscape has collapsed. With $Ethereum still closely tied to BTC’s market dominance, a drop below $70,000 triggered an immediate technical collapse in Ethereum.
Ethereum Technical Analysis: $1800 is the next line of defense
Looking at the ETH/USD 4-hour chart, the price action paints an extremely bearish picture for short-term holders.
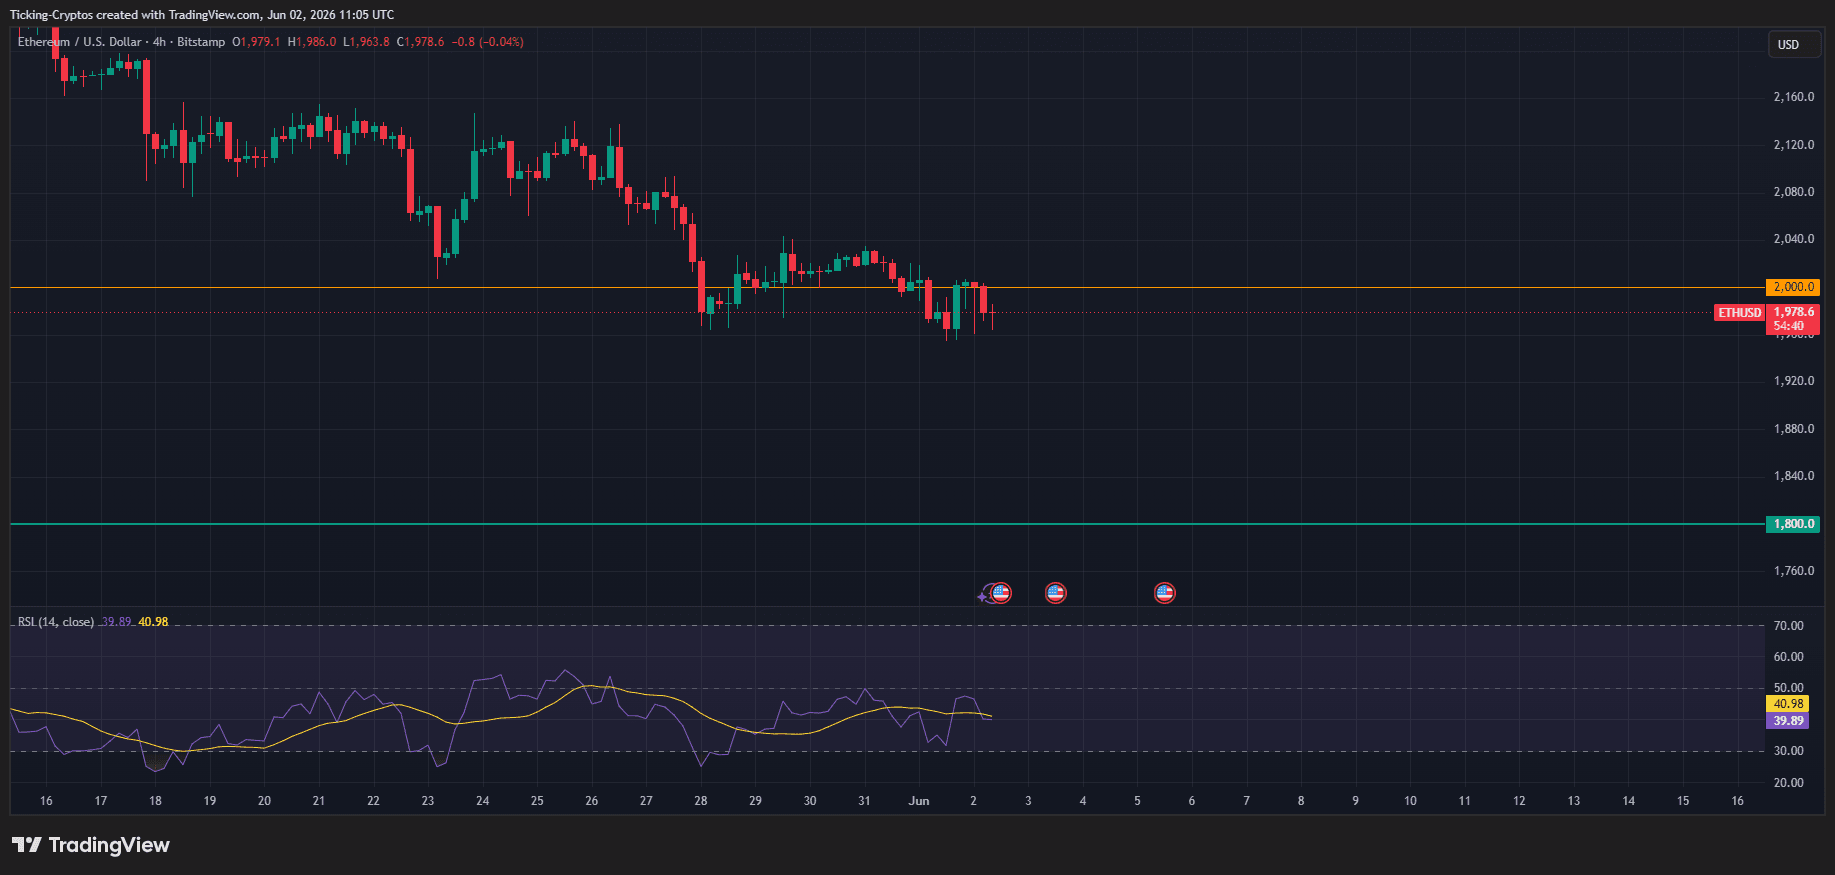
Key technical indicators to monitor:
- $2000 axle: The horizontal orange line represents the critical psychological barrier. By failing to maintain liquidity above $2,000, this area has officially flipped from an active support floor to a major upper resistance level.
- Relative Strength Index (RSI): The 14-period RSI fell to 39.89Suggesting that while the market is approaching oversold conditions, there is still clear room for a momentum-driven decline before the technical bounce continues.
- Baseline $1800: If selling pressure intensifies, the primary macro support targeted by bears is located at the green horizontal line $1,800.0. Traders should closely monitor daily and weekly closes; Structural failure to defend the $1,800 area could risk a deeper retest towards overall lows in late 2024.


