

What does Cardano’s 3-hour chart show now?
The 3-hour chart shows ADA in a wide range with a clear pattern of lower highs. The month opened with a strong push to $0.200 on July 5, a move that was rejected almost immediately and restored every cent of the advance within 48 hours.
The second attempt came on July 23, when Cardano’s price rose to nearly $0.1805 before rolling again. The lower high is important, because it emphasizes sellers’ intervention early on each high. The price then dropped to $0.1535 on July 27, and this is where buyers finally took action.
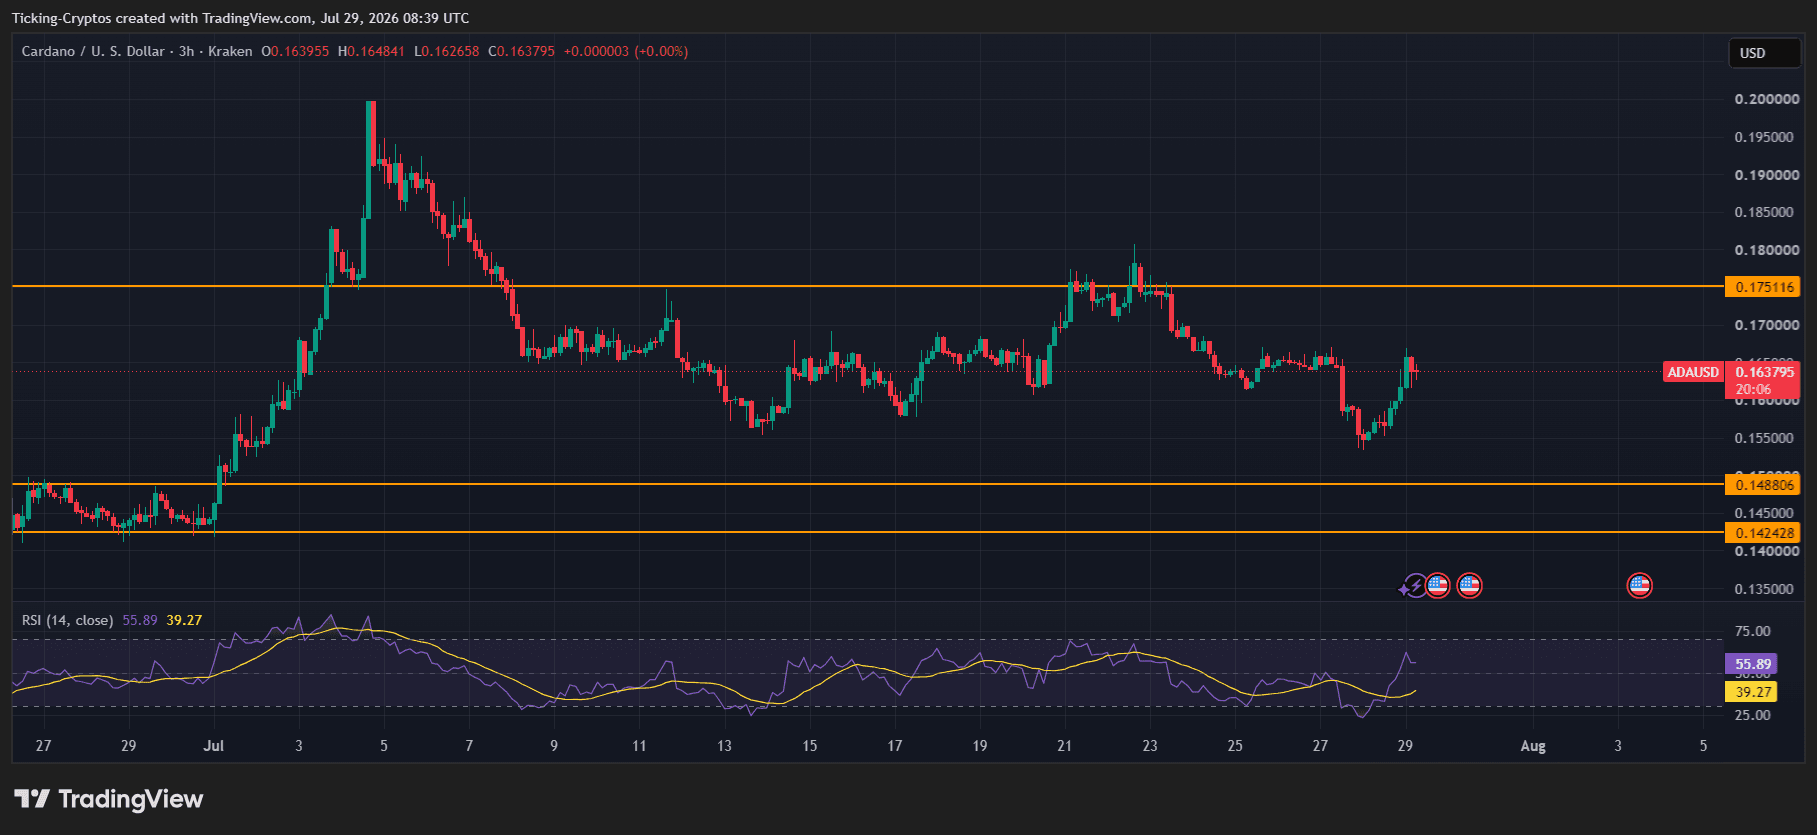
The current candlestick is at $0.1638, with an intraday high of $0.1648 and low of $0.1626. In other words, Ada It has recovered about 6.7% from the swing low but is still about 18% below the July peak.
The structure to keep in mind is simple: three horizontal levels that define everything. Resistance at $0.1751, support at $0.1488, and a deeper support shelf at $0.1424 return to the late June accumulation base.
Why is $0.1751 the level that determines the next move for ADA?
$0.1751 is not a random line. It is the level that capped the entire recovery after the rally in early July and lies directly above the rejection wick on July 23. Everything the ADA did for four weeks happened underneath it.
From $0.1638, this resistance is approximately 6.9% away. A clean 3-hour close above $0.1751, ideally with increasing volume rather than a single wick, would break the sequence of lower highs and bring the $0.180 area back into play as a first target. Above that, the July high of $0.200 becomes the clear magnet, and reclaiming it would be the first real bullish monthly signal ADA has issued since the spring.
Until then, every push towards $0.175 should be treated as a supply zone and not a breakout.
What happens if Cardano loses $0.1488?
The bearish scenario is well defined. $0.1488 is the first real support below the current price, about 9.2% lower, and corresponds to the top of the ADA base that was built until late June.
When that is lost on a closing basis $0.1424 becomes the next stop, roughly 13% below the spot price. This level is the lower bound of the June accumulation range, and is the last structural support before $Cardano returns to the multi-year lows it hit at the end of June, when ADA closed the month near $0.1453 after falling nearly 40%.
One nuance worth noting: the July 27 low of $0.1535 remained comfortably above $0.1488. This is a higher low compared to the June base, which is the only thing more positive on this chart.
Is the RSI signal strong enough to trust?
The 14-period RSI reads 55.89, with its moving average falling at 39.27. This gap tells you two things.
First, the RSI fell near the mid-20s during the July 27 wave, a truly oversold reading on the 3-hour time frame, and the bounce came right off of it. Second, the RSI has now crossed decisively above its signal line, a shift in momentum that usually precedes at least a test of overhead resistance.
The warning is the speed of movement. Going from the oversold area to 56 in three sessions is a rapid requote, and the RSI is now entering the area where last July’s rises stopped. Momentum is improving, but it has not yet confirmed a trend change. This confirmation only comes from a price close above $0.1751.
What fundamentals can support Cardano price?
The artistic image does not operate in a vacuum. Cardano has just moved through one of its busiest development phases: the Van Rossem hard fork moved the network to version 11 of the protocol, adding new built-in Plutus functionality and updated cost models that reduce the resources needed to run complex smart contracts. It was also the first Cardano upgrade to be fully authenticated by the on-chain Voltaire management system.
Behind it lies Ouroboros Leios, a scalability fix that went to the public testnet in June and is targeting the mainnet in late 2026. Charles Hoskinson framed it as an incremental change in throughput, with numbers in the 10x to 65x range put forward by the community, though these numbers still need to withstand real-world load.
On-chain, Santiment data showed that wallets containing between 10 million and 100 million ADA raised their share of supply from 37.66% to 38.13% during the June sell-off. Whales accumulating weakness does not lead to a bottom, but it explains why $0.1424 has held up so far. In contrast, the number of daily transactions fell to approximately 17,400 at the end of June, near a 45-day low, so usage has not yet followed development activity.
What are the key levels to monitor for ADA?
- Resistance 1: $0.1751, the level that capped every rally this month
- Resistance 2: $0.180, the highest level of rejection on July 23
- Resistance 3: $0.200, July peak
- Support 1: $0.1535, the lowest price on July 27
- Support 2: $0.1488, the first structural support
- Support 3: $0.1424, minimum accumulation for June
The base case is range continuation: ADA grinds between $0.1488 and $0.1751 as the market waits for a catalyst. The bullish impetus is a 3-hour close above $0.1751. The downside trigger is a close below $0.1488. Anything in between is noise.


