

Bitcoin Reaches $80,000: What Happens Next?
Bitcoin (BTC) made headlines this morning, May 4, 2026, by surpassing key psychological resistance of $80,000. The move marks the highest price point for the leading cryptocurrency since January, sparking a wave of optimism across the digital asset market.
The breakout was driven by a “short squeeze” and positive geopolitical developments regarding the “Freedom Project” in the Middle East, which eased global risk concerns. After peaking at around $80,617, BTC price has seen a slight healthy adjustment, and is currently trading $79,740.
Why is the price of Bitcoin rising?
- Institutional demand: Spot Bitcoin ETFs saw a massive $630 million inflow last Friday, providing the liquidity needed for this morning’s push.
- Geopolitical relief: News of successful negotiations in the Strait of Hormuz has allowed risk assets like Bitcoin to flourish as the “digital gold” narrative develops.
- Technical short squeeze: Over $300 million worth of short positions were liquidated within 24 hours, accelerating the upward momentum as traders were forced to buy back their positions.
Bitcoin Price Analysis: BTC/USD Chart Breakdown
The current daily chart reveals a decisive shift in market structure. After weeks of consolidation, the bulls have succeeded in breaking the key resistance area.
Support and resistance reversal
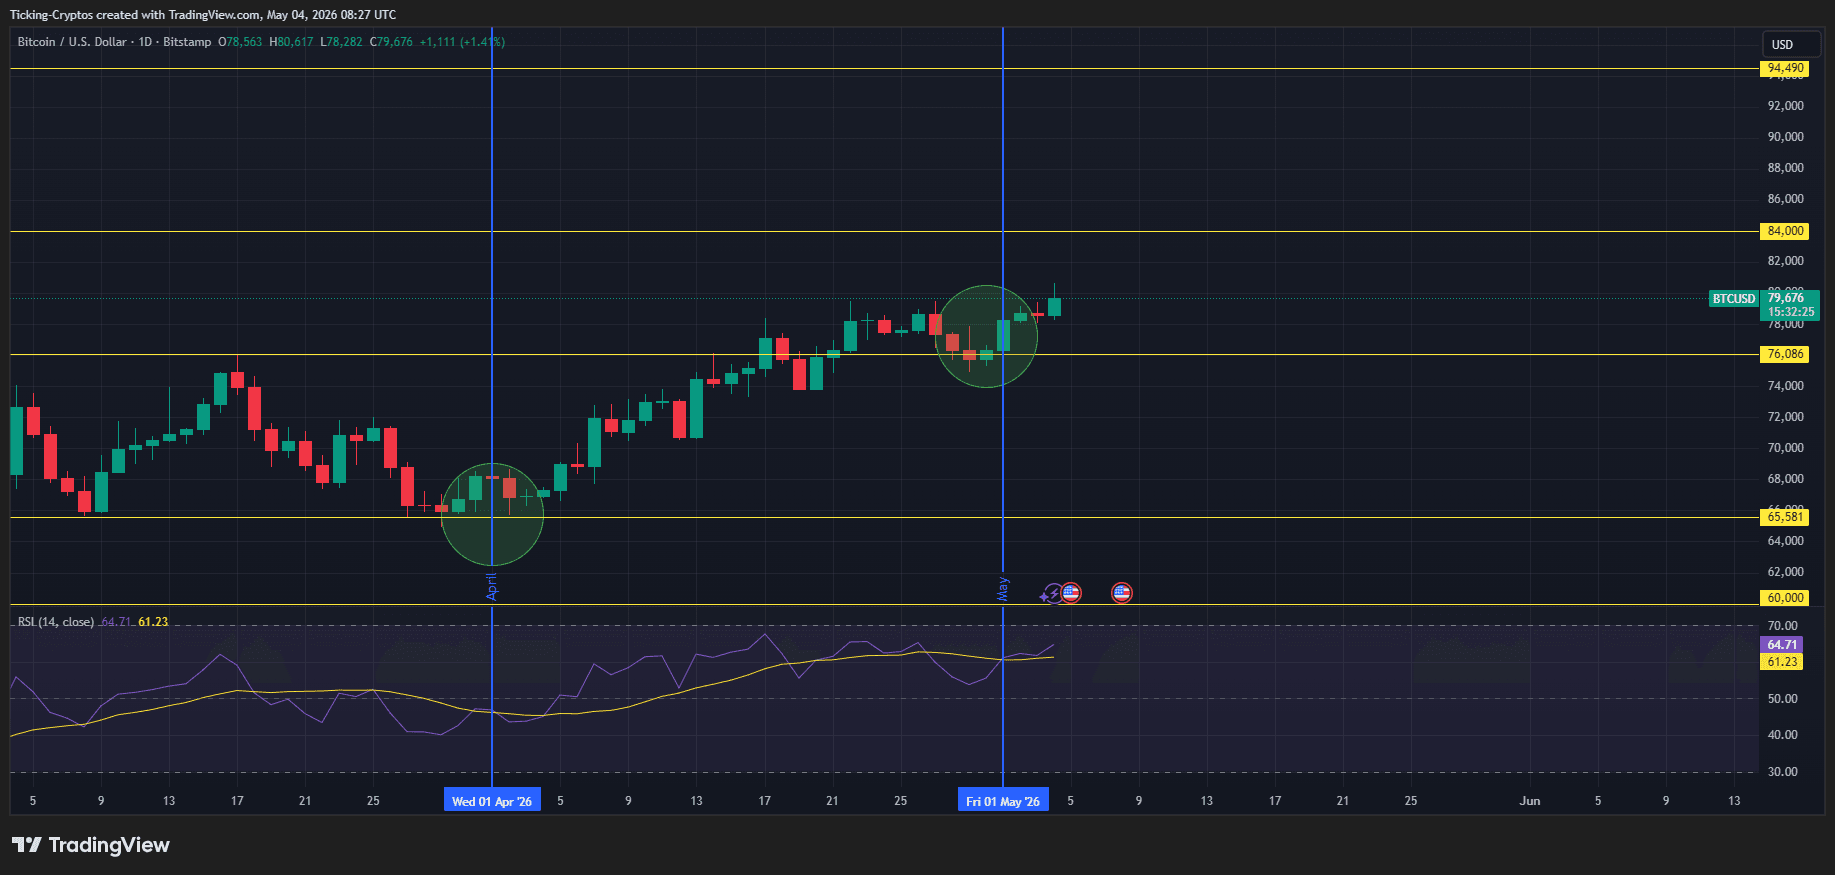
Looking at the technical indicators,… $76,086 The level, which previously served as a ceiling, is now established as a stable support floor (highlighted by the last green accumulation circle on the chart).
- Current resistance: Highest level of the day $80,617 It is the immediate obstacle.
- Rising target: If Bitcoin maintains its position above $79,000, the next technical target is $84,000followed by a long-term projection towards $94,490.
- RSI: The Relative Strength Index is currently at 64.71. While this shows strong buying momentum, it is still below the “overbought” threshold of 70, suggesting that the rally has more room to run before a major correction is needed.
Assembly areas
The chart highlights a large accumulation area nearby $65,581. This area served as the base of the current rise. As long as Bitcoin remains above the intermediate support level $76,086Encryption news The cycle is likely to remain dominated by “buy the dip” sentiment.
Bitcoin Price Prediction: Can BTC Reach $100,000 in May?
Many analysts are now updating their data Bitcoin price Expectations after this morning’s events. A decisive breakout at $80,000 turned short-term momentum into a “strong rally.”
- Short term (weekly): The combination between $78,500 and $81,000 is expected to build a new base.
- Mid-term (May 2026): If ETF flows continue at the current pace, a retest will take place $85,000 Very likely by the middle of the month.
- Optimistic scenario: Some institutional goals now range from $94,000 to $130,000 For the second half of 2026, provided that current macroeconomic stability continues.
Bitcoin Price Targets: Key Price Levels
| Level type | Price point (in USD) | Artistic importance |
|---|---|---|
| The great resistance | $84,000 | Next is the psychological barrier |
| Current axis | $79,740 | Current trading range |
| Instant support | $76,086 | Previous breakout point |
| Macro support | $65,581 | Confirm the long-term trend |
With the market absorbing the 80K level, Early Inquiry Confirmation suggests that buyers are still in control, although a short period of sideways movement would be a healthy sign of market maturity at these levels.


