
The US stock market is showing a small red flag today, down 0.03% at press time, but it’s not all bad. The Consumer Price Index (CPI) for March, a measure of price changes, came in at 3.3% year over year. However, weak core inflation and a strong AI-led Nasdaq rally kept the damage under control.
Three forces shaped the session. All three connect with one question. Will overall war-induced inflation or lower core prices set the tone for April?
1. March CPI reaches 3.3% as energy costs rise in the Iran war
The Bureau of Labor Statistics reported that the headline Consumer Price Index rose 0.9% month-over-month and 3.3% year-over-year. That represented the highest annual increase since May 2024. Gasoline alone jumped 21.2% in one month as the disruption of the Strait of Hormuz pushed fuel costs into the data.
but, The core CPI rose just 0.2% month-on-month On a monthly basis and 2.6% on an annual basis.
This matched expectations and kept Treasury yields stable. Markets read the split as a war shock rather than widespread inflation.
2. The strength of artificial intelligence and semiconductors lifts the Nasdaq index into the green zone
While the S&P 500 and the Dow Jones index fell The Nasdaq Composite Index rose 0.38%.. AI and chip names led the rise. Furthermore, TSMC reported record revenues in the first quarter, showing resilience despite geopolitical risks.
Broadcom (AVGO) shares rose 4.54%. Nvidia (NVDA) shares rose 2.29%. AMD (AMD) rose 3.43%. CoreWeave (CRWV) jumped after announcing multi-year cloud deals with Anthropic and Meta.
3. Narrow presentation reveals alternation, not broad conviction
Market breadth remained weak, with only about 42% of issues advancing. Gains remained concentrated in technology and capital-intensive materials. Meanwhile, health care, financial and consumer defense stocks fell, pulling the S&P and Dow Jones lower while the Nasdaq masked weakness.
What happened to the major US indices?
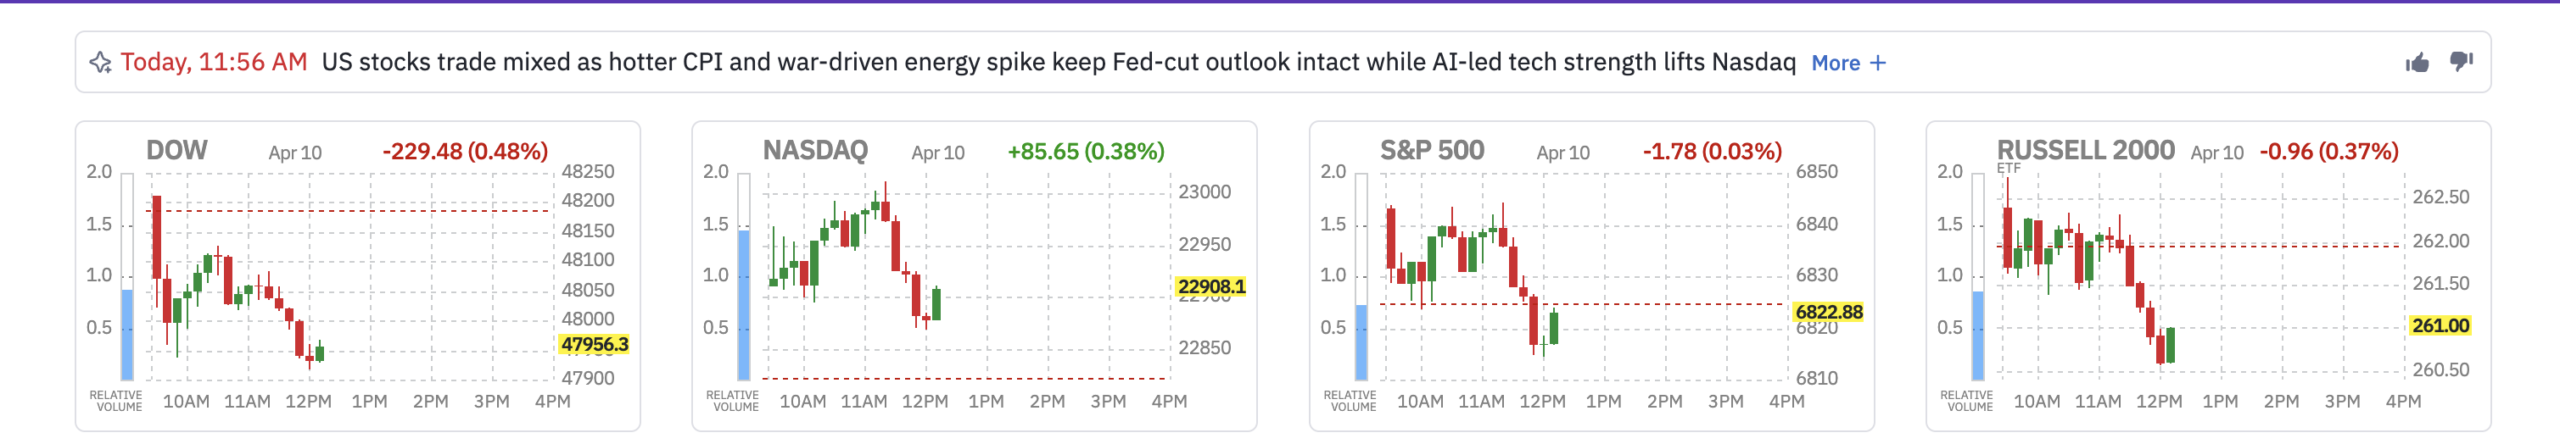
At the time of writing, three of the four major indicators were in the red.
- The Russell 2000 fell 0.96 points (−0.37%) to 261.00
- The S&P 500 index fell 1.78 points (-0.03%) to 6,822.88 points.
- The Dow Jones Industrial Average fell 229.48 points (-0.48%) to 47,956.30
The only other notable indicator was the Nasdaq Composite, which rose 85.65 points (+0.38%) to 22,908.10, signaling a shift to technology.

The S&P 500 is now trading above all four Exponential Moving Averages (EMA), the trend indicators that weigh most heavily on recent prices. This has not happened since February.
The 20-day EMA at 6,657 closes at the 50-day EMA at 6,719. Meanwhile, the 50-day price is close to the 100-day price at 6,731. Multiple bullish crossovers are lined up.
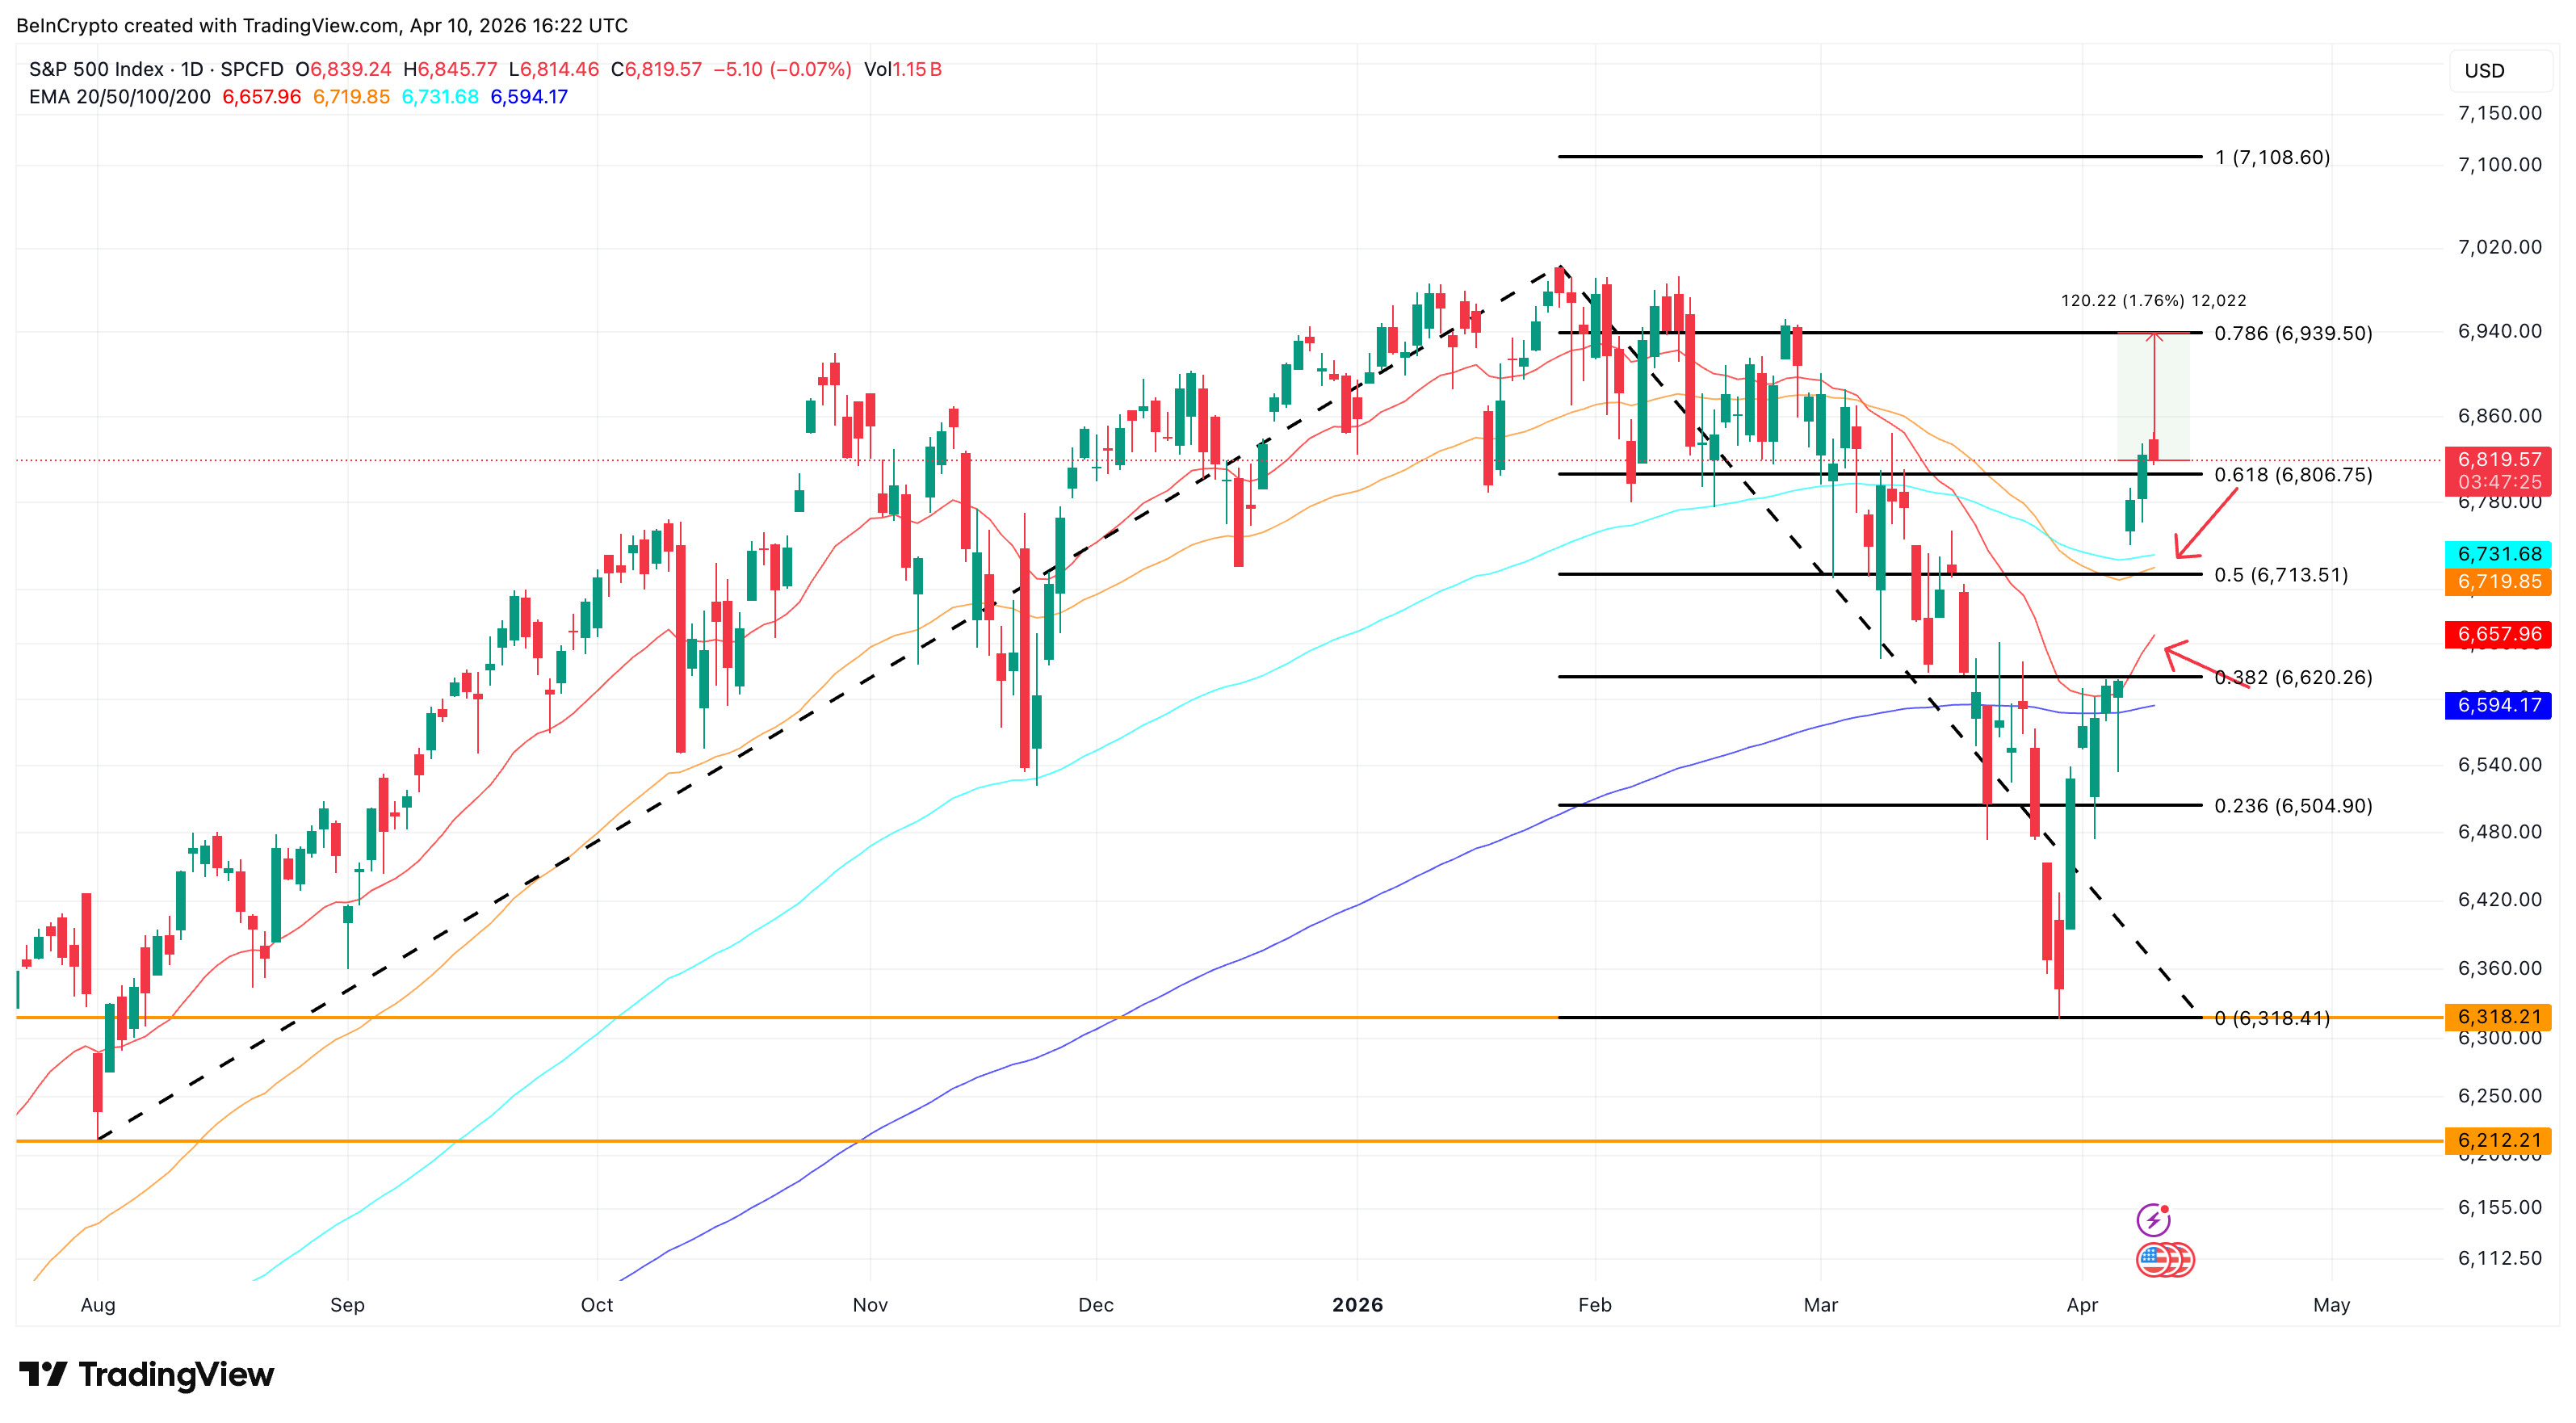
Since touching a Possible bottom at 6,318 On March 30, the index saw a V-shaped recovery. It has regained levels last seen in mid-March. However, the 0.618 Fibonacci level at 6806 remains the critical threshold. Staying above this level keeps 6,939 and 7,108 in play. However, a drop below 6,806 would expose an EMA range near 6,719 to 6,731. Below that, 6,713 serves as the next floor.
What are the resilient sectors?
Basic materials stocks advanced +0.72%. Strength in gold and silver supported the sector as higher CPI readings increased demand for real assets as inflation hedges.
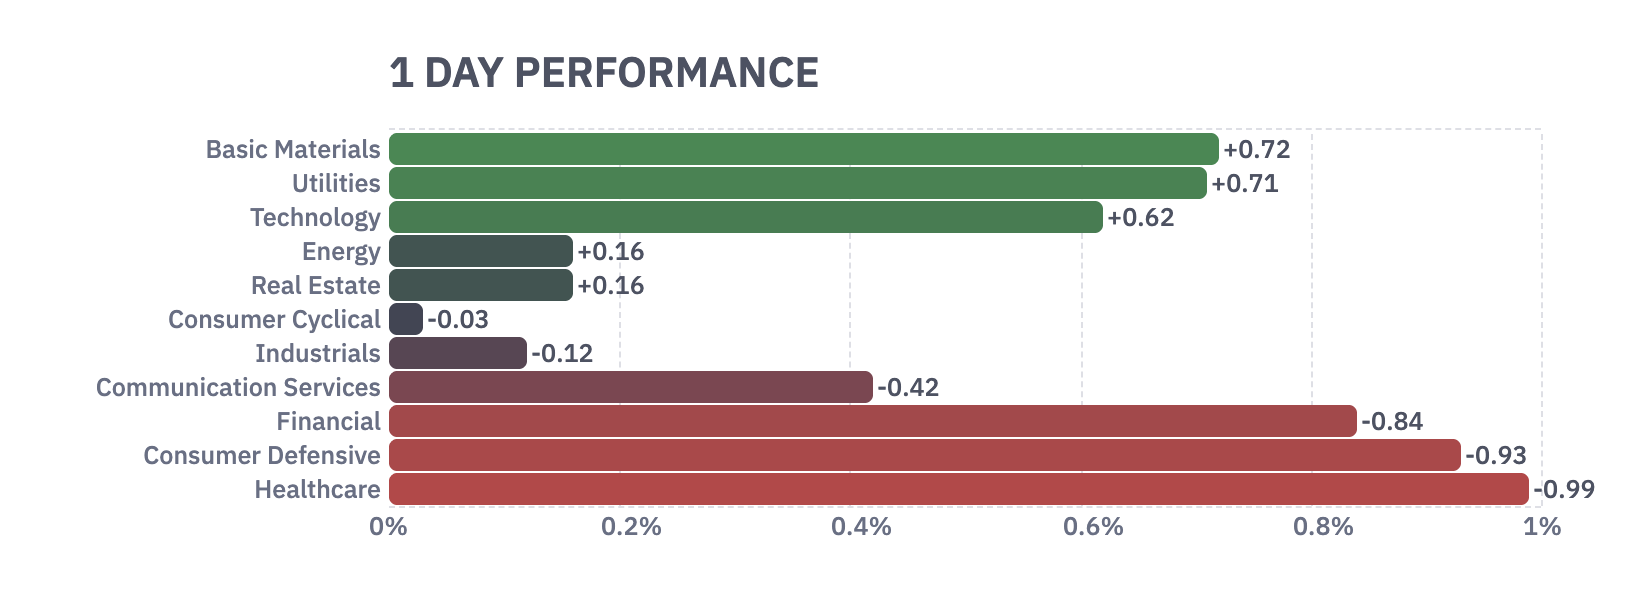
Utilities rose, +0.71% as high-yielding stocks attracted capital on a day of heavy inflation. Technology acquired +0.62%, driven almost entirely by the AI semiconductor group after TSMC’s win.
Which sectors are declining?
Healthcare led the losses at -0.99%. Eli Lilly (LLY) fell 1.61% while AbbVie (ABBV) fell 1.04%. One possible reason may be the fact that higher inflation leads to higher input costs for drug manufacturers.
Consumer Defense also fell by -0.93%. Costco (COST) is down 1.61% and Walmart (WMT) is down 1.41%. Despite their safe-haven reputation, rising fuel costs are squeezing these retailers’ profit margins.
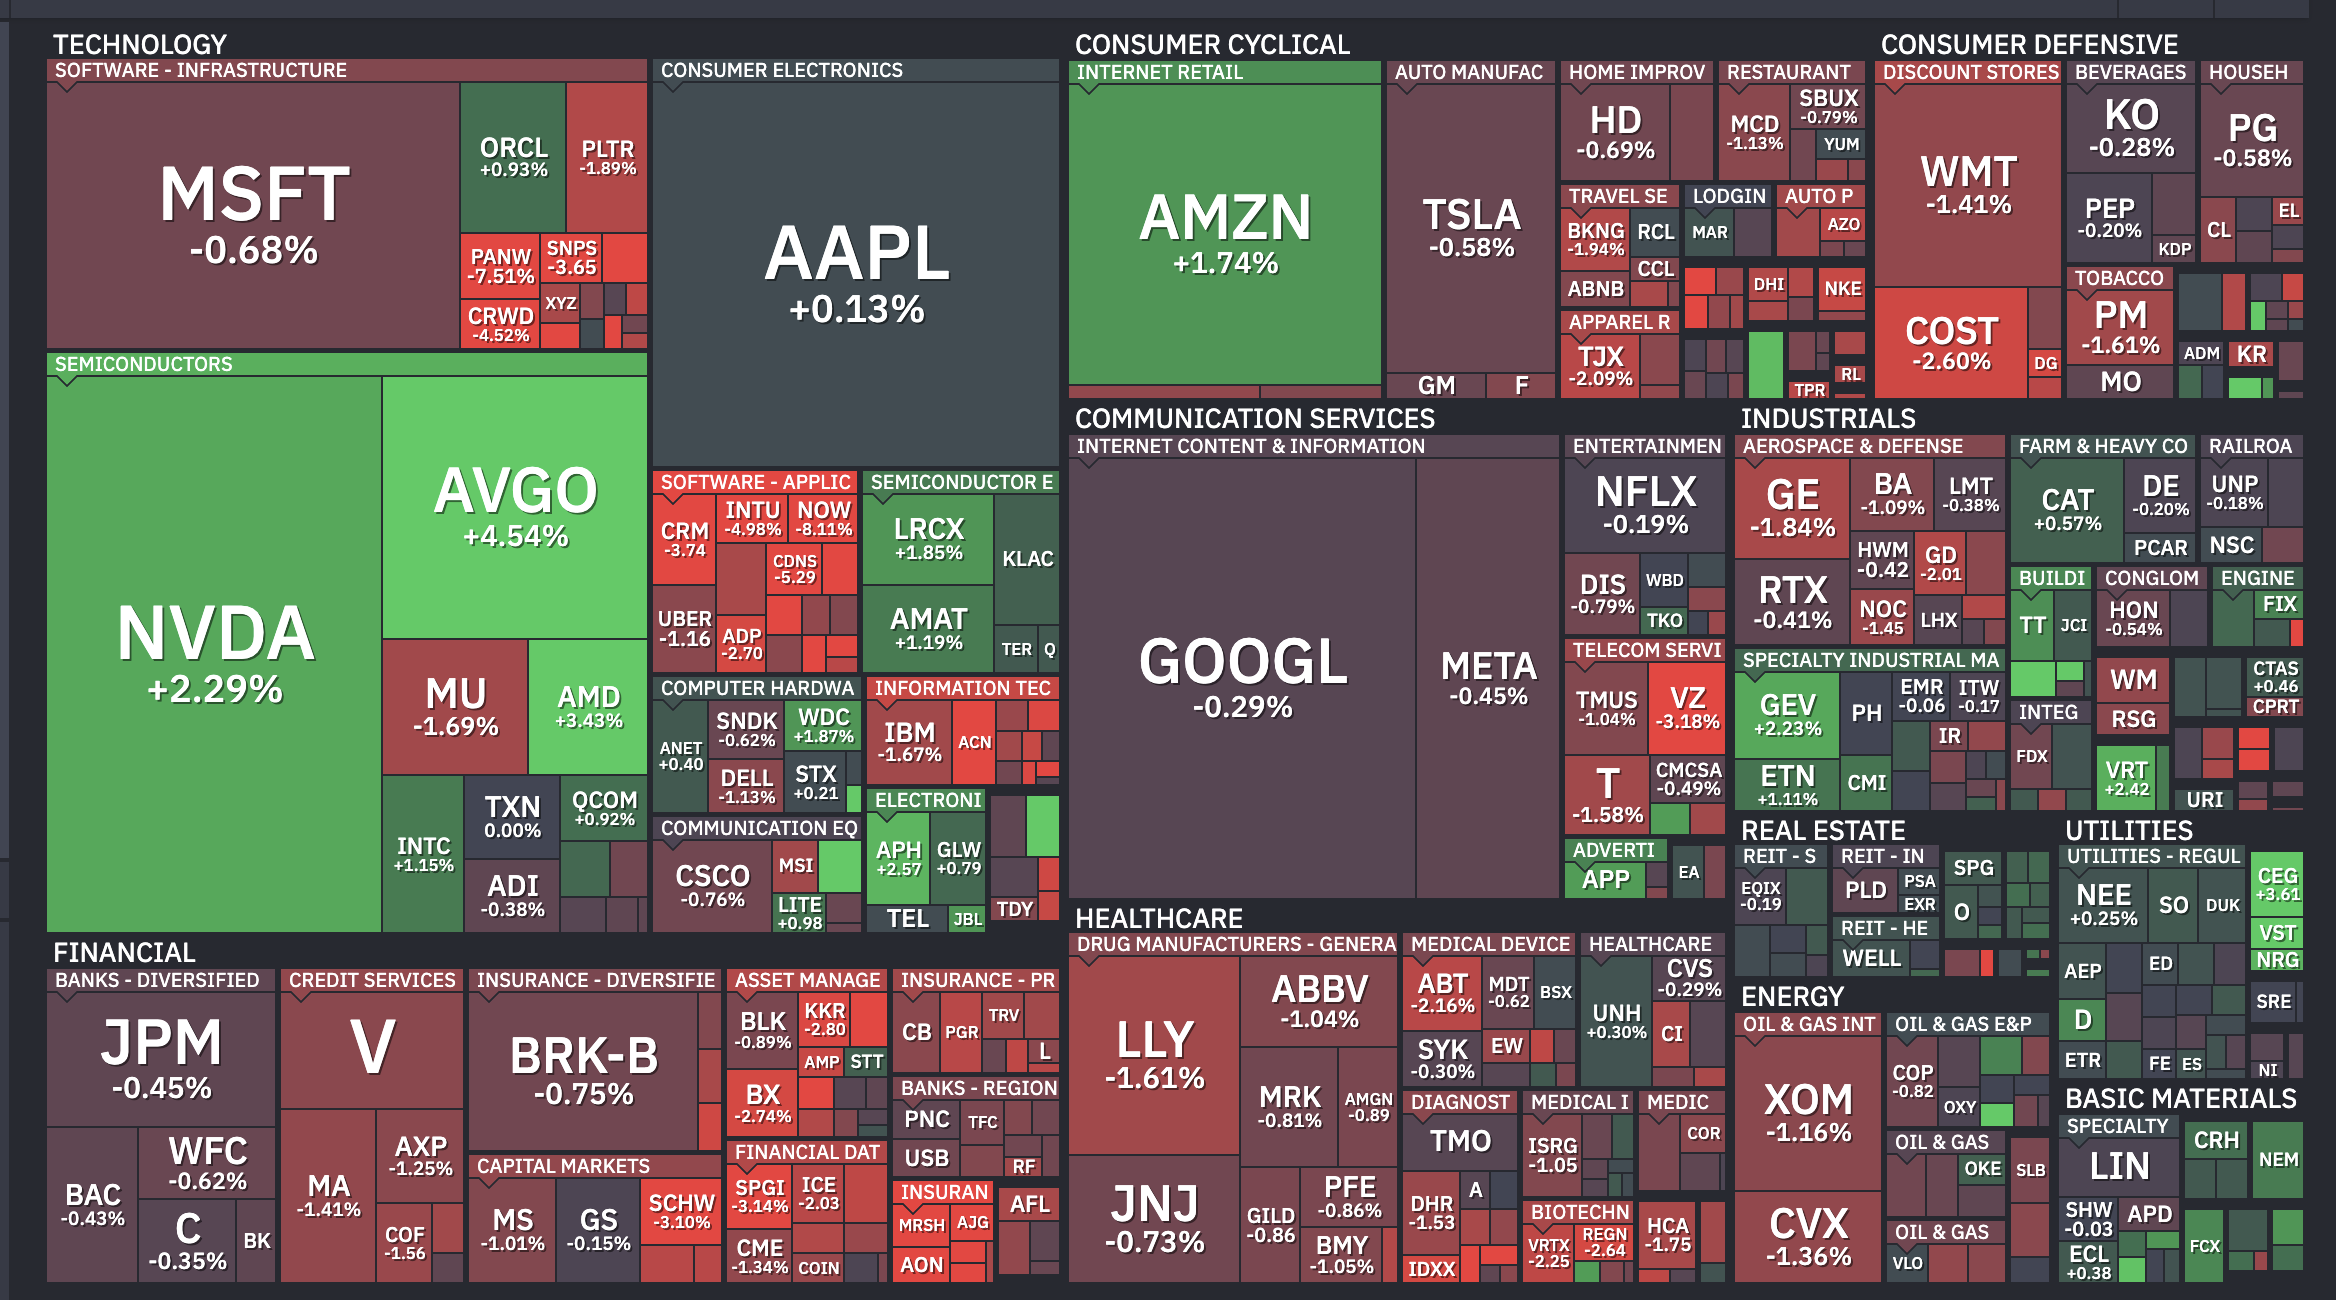
The financial sector fell by -0.84%. JPMorgan (JPM) fell 0.45% and Goldman Sachs (GS) fell 0.15%. Hotter headline inflation reduces the likelihood of interest rate cuts in the near term. This limits the net interest margin expansion that banks need for earnings growth.
Top stock news investors are watching
- Broadcom (AVGO) stock rose 4.54% after TSMC’s record first-quarter results reinforced that demand for AI chips remains strong despite macro headwinds.
- CoreWeave (CRWV) stock jumped more than 12% after pricing a massive $3.5 billion offering of convertible securities. The company also expanded its Meta AI deal to $21 billion and signed a multi-year agreement to power Anthropic’s Claude models.
Palantir (PLTR) stock fell 1.89% after investor Michael Burry publicly criticized the company’s competitive position in artificial intelligence.
What are investors watching next?
Weekend ceasefire talks between the United States and Iran will determine whether oil prices extend or reverse their decline. Any collapse would cause energy costs to rise again, reinforcing today’s inflation shock.
At the same time, Federal Open Market Committee meeting on April 29 The next major decision is on the interest rate.
Core CPI came in weak but headline inflation rose. Whether the Fed treats this as a temporary energy shock or a broader problem will determine the course through May.
this post Why did the US stock market fall today? appeared first on BeInCrypto.


