


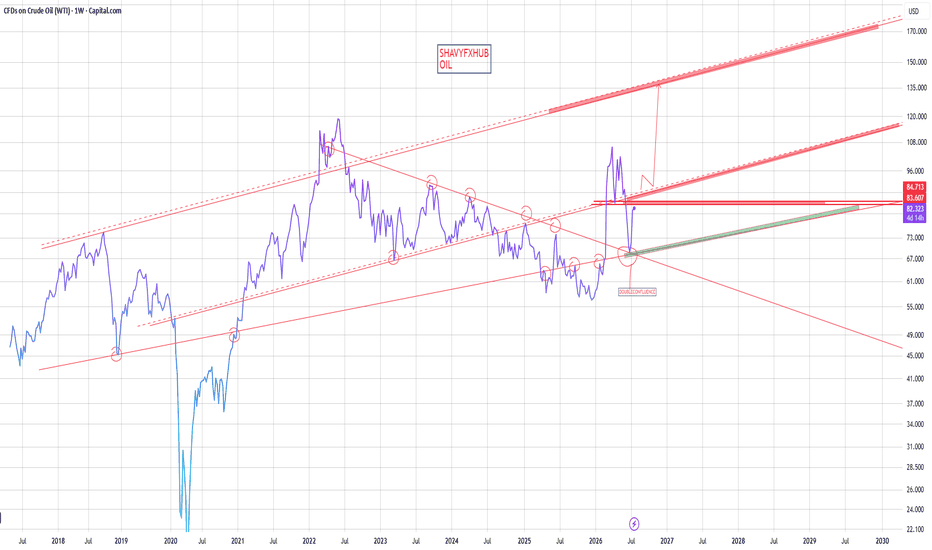
WTI weekly oil line chart
Long-term market structure
This weekly chart gives a big picture of crude oil from the 2018 to 2030 forecast.
Key notes:
Oil has been in a long-term upward channel (red trend lines) since the 2020 coronavirus-induced low.
The structure shows lower lows over time – a long-term bull market structure.
The price has respected the green demand floor several times.
Recent price action shows consolidation near the upper red channel line after a strong rally.
Current technical status:
Oil is trading around the $82-$84 area.
The downtrend line is now being tested in black (short term).
The double confluence zone marked on the chart is a key area where trend lines and horizontal levels meet.
Structure expectations:
Bullish bias on the higher time frame as long as the price remains above the green demand floor.
Next upside target: Upper Red Channel Line (~$90-$100+).
There is a risk of a pullback if the black downtrend line continues as resistance.
Oil remains in a long-term uptrend with current consolidation. A green demand floor is the most important support to watch.
#Oil #West Texas Intermediate Crude


