


author
Ahmed Barakat
author

Share


Mark Zuckerberg’s Meta AI just framed the gold and silver price prediction as two sides of the same macro trade heading into the end of the year. The model expects gold to rise toward $4,800 to $5,200 and silver to rise to $78 to $90 by the end of 2026.
The bull case treats both metals as beneficiaries of the same set of conditions rather than separate stories. With real interest rates remaining negative as central banks turn to cuts amid persistent fiscal deficits, the opportunity cost of holding non-yielding assets like gold and silver disappears completely.
De-dollarization continues to accelerate central bank buying in emerging markets, adding a structural supply under gold that is not dependent on any single country’s monetary policy decision.
Silver gets a dual driver of demand that gold doesn’t have, combining that same monetary demand with structural industrial deficits caused by solar panels, electric vehicles, and electronics manufacturing that eat up physical supply faster than miners can replace it.
Supply constraints caused by low ore grades and a lack of investment in new mines add a long-term scarcity premium on top of that. The geopolitical risk premium keeps both safe-haven metals bullish, and retail ETF inflows continue to bring new capital into the space.
Together the model frames this as a setup where both metals could move much higher simply by continuing on the already moving path.
A bearish situation requires a specific and rather dramatic total reversal. If inflation collapses faster than expected and the Fed raises interest rates again to 6% or higher, gold could retest $3,600 and silver $48 on liquidation with real interest rates turning sharply positive and the holding case for either metal weakening.
Even in this scenario, the model says dips will be strongly bought given that 2026 debt ceiling dynamics and election uncertainty limit dollar strength from the other side.
Gold and Silver Price Forecast: Gold retreats from all-time highs while silver rebounds from a year’s worth of gains
the Gold price The chart shows spot prices at US$4,098.72 after an exceptional rise from around US$3,400 in September last year to a peak near US$5,500 set in early February.
This parabolic move was one of gold’s strongest sustained rallies ever, and the pullback since then has been just as steep, with the price falling from those highs to $4,000 over the past five months.
The current level puts gold in the middle of the bearish case retest zone mentioned in this forecast, just above $3,600 but well below where buyers need to see it for the bullish case to remain intact.
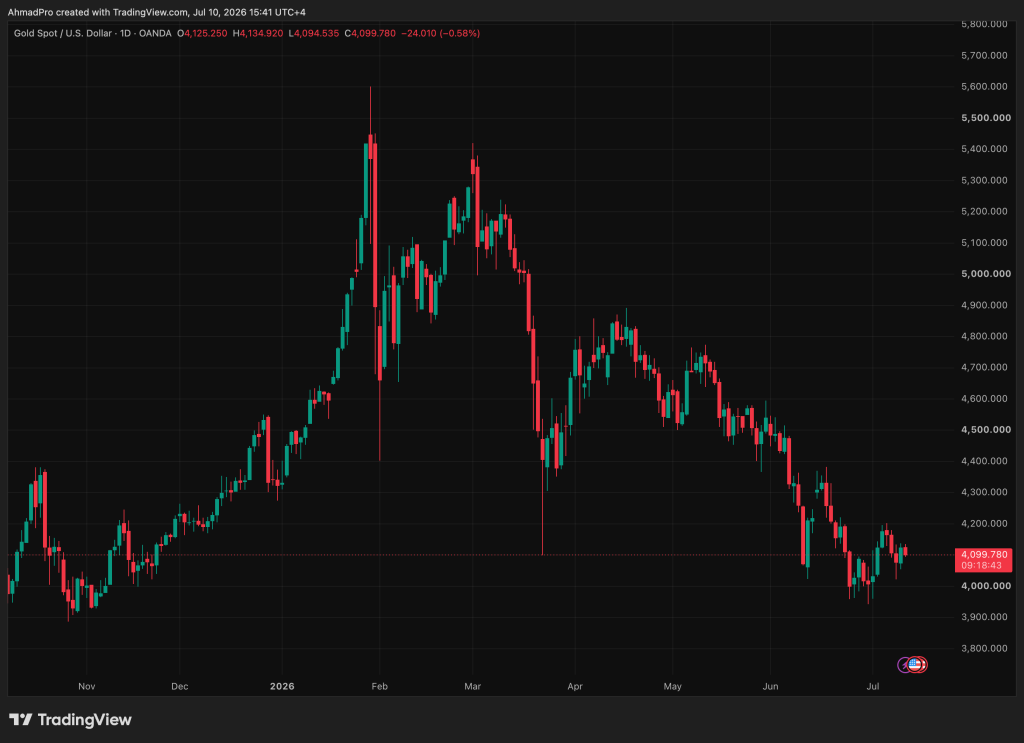
Resistance lies first at $4,300, then a heavier ceiling near $4,700 to $4,800, where a secondary high formed in March after the initial peak faded.
Support remains near $4,000, a round psychological number that has been tested several times over the past two weeks and has remained stable. The overall structure looks like a natural correction within a long-term uptrend rather than a trend reversal, which fits the macroeconomic hypothesis well.
The silver chart tells a more volatile version of the same story. Silver is at $59,329 after a more dramatic rise from around $48 last November to a peak near $120 in early February, followed by a sharp collapse and extended volatility that has now brought the price back to the $57 to $60 region.
This level is notable because it is near the $48 bearish floor mentioned in this forecast, meaning silver has already given up most of its gains in 2026 even though the fundamental story remains intact.
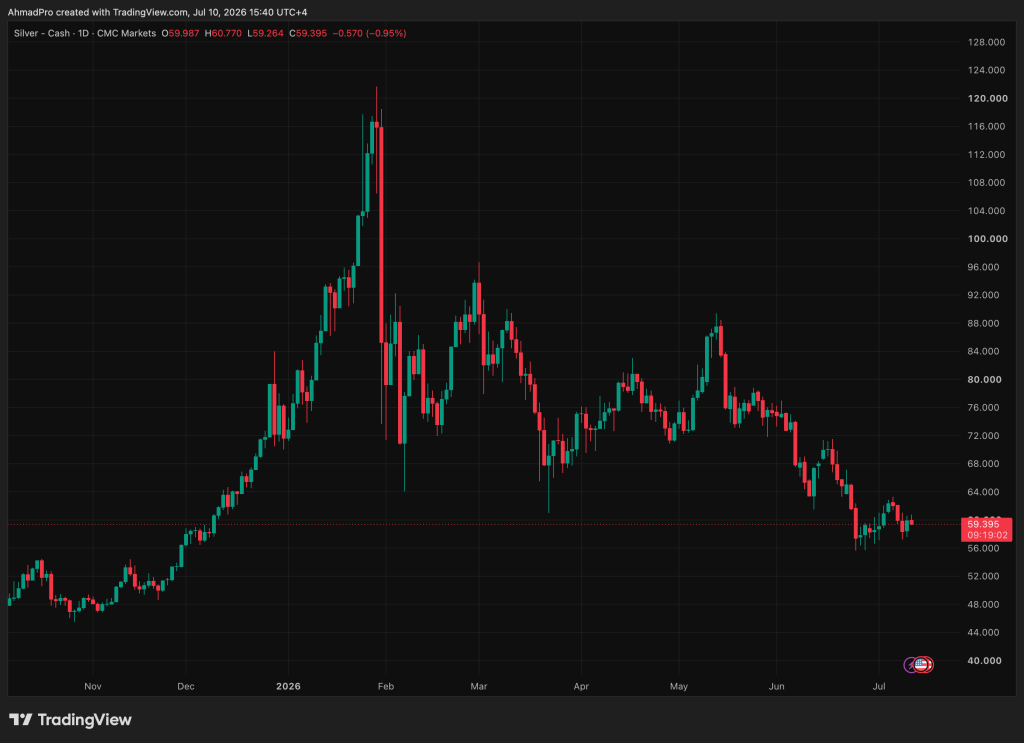
Resistance lies near $68 to $70, with a much heavier wall near $80 where multiple rally attempts throughout the year have stalled. Support lies at the recent lows near $56 to $57.
For bull case targets to reach $78 to $90, silver would need to reclaim $68 resistance and build momentum to $80, which would require a more sustained macro catalyst than what has been demonstrated so far in 2026.
Don’t miss your chance to get a $1000 Airdrop on ByBit
Discover: The best cryptocurrencies to diversify your investment portfolio
Here’s what Meta AI predicts for LiquidChain in the near future Could this reach 1000x?
Waiting on breakout resistance is standing in line. Someone else’s balance sheet makes that decision.
Bitcoin, Ethereum, and XRP have been pressing the same ceiling for weeks. The trigger is always to print a single data. Institutional flows are always in the next quarter. Large capital traders wait for moves they cannot control.
Early-stage infrastructure plays by different rules. Capital recorded as statistical noise on the Bitcoin scale moves a small, undiscovered project by multiples. The asymmetric return lies in one place: the gap between the project’s value and its market price. This gap exists because no one has found it yet. Once they do, the gap closes.
Cross-chain hashing has been pulling value out of DeFi since the first bridge went live. Bitcoin, Ethereum, and Solana were created as independent systems with no common architecture and no intention of interoperability. Every transaction that crosses that boundary pays the price for that design decision in terms of fees, slippage, and failed executions. Bridges were the proposed solution. They become the mechanism through which the problem exacts its toll.
LiquidChain eliminates these losses. Three networks within one implementation layer. A single deployment reaches them all without a cross-chain tax on any interaction.
Meta AI marked the project as worth watching. The presale is at $0.01454 with $835,000 raised. Implementation not installed. Adoption is unknown.
Existing assets provide a predictable path toward the ceiling that the market is already seeing. LiquidChain is an entry point that is closed as soon as the market finds it.


