
—
### 🧠 **Market Structure**
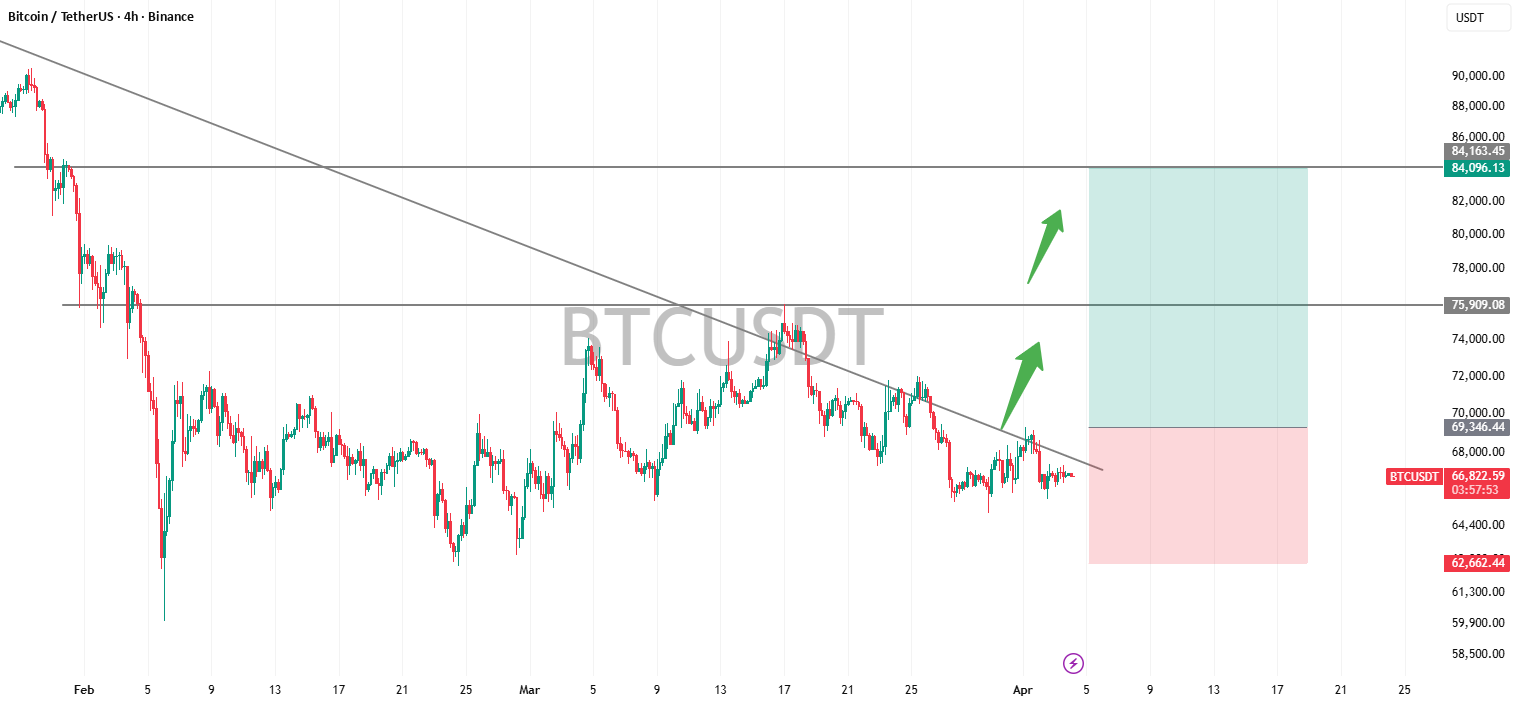
* Trend: ** Bearish ← Consolidation **
* Price Action: ** Narrow range formation **
*Main signal: **low highs + compression**
—
### 📍 **Main Levels**
* Resistance: **75,900**
*Main resistance: **84,000**
*Support: **69,300**
* Strong support: **62,600**
—
### 🚀 **Bullish scenario**
If the price breaks the **trend line**:
*First step → **75,900**
*continuation → **84,000**
This is in line with the **Breakout Expansion Setup** (as shown in your chart).
—
### 📉 **Bearish scenario**
If the price ** fails to breakout and is rejected **:
* Decrease towards **69,300**
* Possibility of continuing in ** 62,600 liquidity area **
—
### ⚖️ **Business idea**
*Entry: **Breakout or pullback entry**
*Stop Level: **Less than 62,600**
*TP: **75,900 → 84,000**
—
### 💡 **Conclusion**
This is the **compression stage before expansion**:
➡️ Breakout = strong upward momentum
➡️ Rejection = continued decline
The smart money is waiting for confirmation – not speculation.


