
✅ Artistic look
🌐 Daily Chart: Gold broke strongly above the key resistance level at $4,670 per ounce and closed higher. The short-term moving averages form a bullish alignment, with the price remaining firmly above all the moving averages, keeping the upward momentum intact. The red MACD histograms continue to expand with the golden cross rising well above the zero line, and no divergence signals. KDJ is rising towards overbought territory but still maintains upside potential.
🌐 4-hour chart: Gold accelerated higher, breaking the consolidation range and entering a strong upward channel. The RSI is bouncing sharply from its lows and approaching overbought territory – bullish momentum remains strong, with profit-taking pullbacks expected in the short term. The red MACD bars are expanding further, with the bearish pressure completely exhausted. Bollinger bands widen sharply. The price breaks above the upper band, indicating a slight pullback to retest the 5MA before resuming the uptrend.
✅Key price levels
Support: $4,600 (primary support), $4,640 secondary support in the near term
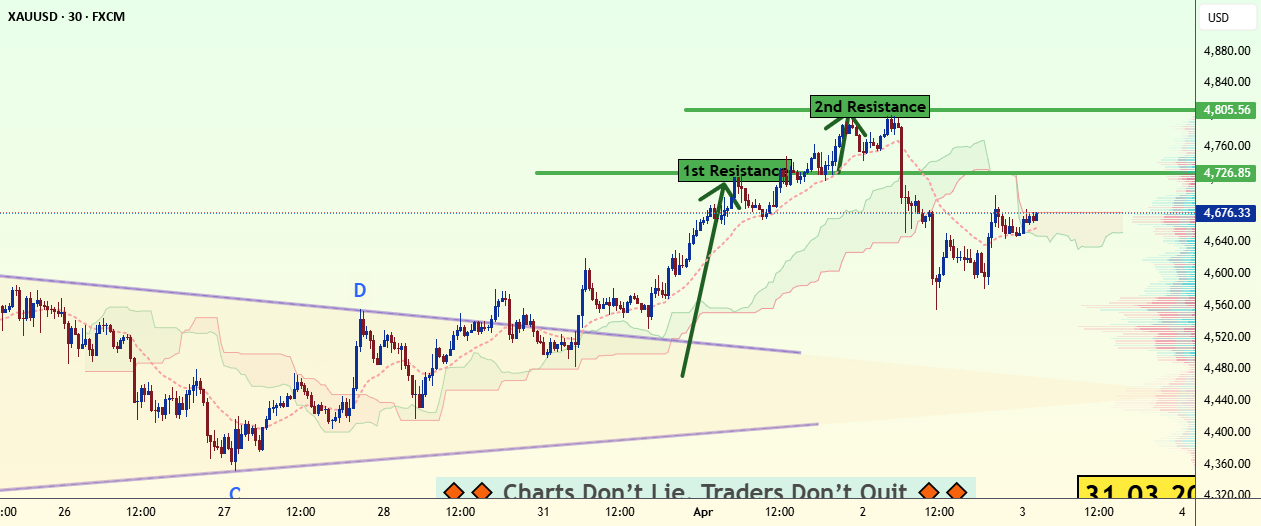
Resistance: around $4,700; Levels above $4,760 are considered an extreme divergence zone, with the ultimate structural target at $5,390.


