

Bitcoin saw a sharp and surprising correction, breaking out of a recent consolidation range to test lower macro support levels. The major cryptocurrency fell towards the $71,000 threshold, leaving traders wondering whether the psychological support at $70,000 will hold or whether a broader market liquidation is underway.
This decline comes at a very ironic moment for market participants, as it arrives alongside major capital restructuring updates from Michael Saylor Strategy (formerly MicroStrategy).
Bitcoin Price Analysis: What Happened to BTC?
The BTC/USD 4-hour chart paints a clear bearish picture in the short term. After spending days consolidating in a tight distribution phase between $73,100 and $74,500, the bears are firmly in control.
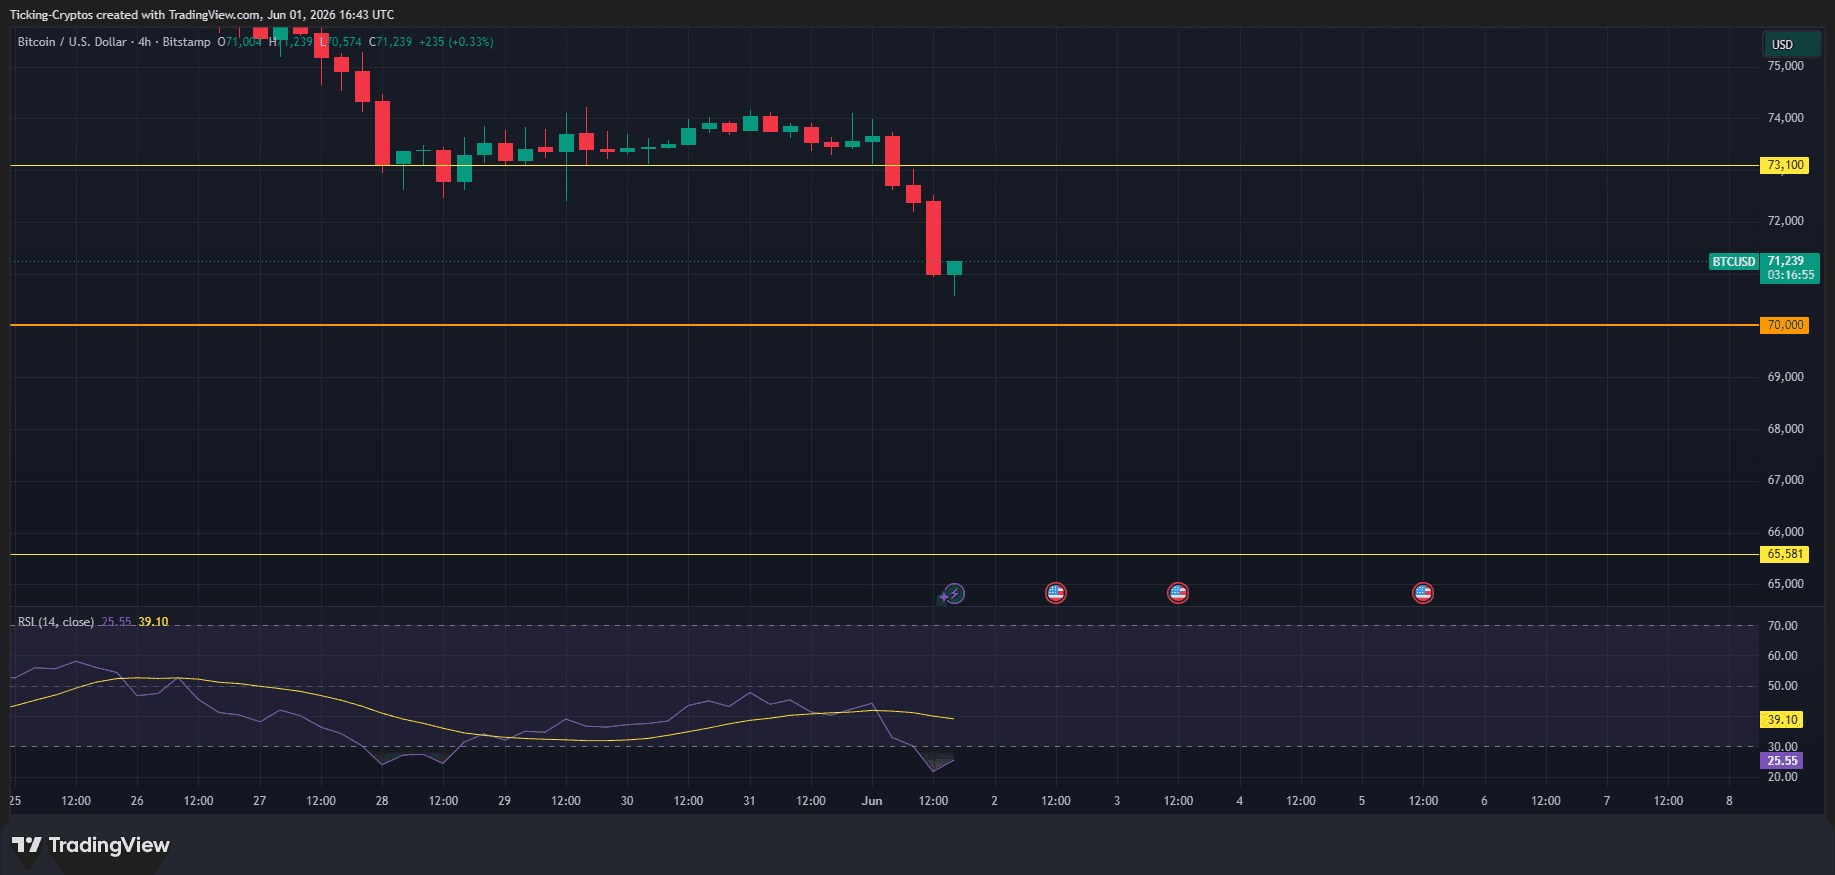
Key support and resistance levels
- Immediate resistance ($73,100): This level served as consistent fundamental support throughout the last week of May. Now that the price has clearly fallen below it, this yellow horizontal line will serve as major overhead resistance in any corrective rallies.
- Crucial floor ($70,000): This is the final line in the sand for a bullish continuation. A breakout beyond this psychological milestone may lead to cascading losses and a deeper correction towards the next macro structure level at $65,581.
The RSI is flashing deep oversold signals
The Relative Strength Index (RSI-14) fell sharply to… 25.55is heading well into the oversold zone. While an RSI in the oversold zone indicates that spot selling pressure may be excessive, it is also showing intense downside momentum. In severe downtrends, the RSI can remain suppressed for long periods before a meaningful reversal is achieved.
Michael Saylor is the only buyer, not the only seller
An important discussion point during this downward movement is the structural dynamic of institutional accumulation versus broader market distributions. Michael Saylor’s strategy recently made headlines by funneling a whopping $2.0 billion via the capital markets to aggressively accumulate another 24,869 Bitcoins, bringing their total holdings to a staggering $843,706.
However, the broader market soon recognized a fundamental structural flaw: Saylor may be the most persistent buyer, but he’s not the only participant in the market.
While the strategy acts as a continuous vacuum for supply trading, systemic liquidity factors trump this single-source purchasing power:
- Exhaustion of Spot ETFs: More widely traded Bitcoin ETFs have seen choppy inflows, failing to sustain the massive bullish momentum seen earlier in the year.
- Total Capital Requirements: In an unexpected development, SEC filings revealed that Strategy executed a rare, minor sale of 32 bitcoins ($2.5 million) to fund the companies’ preferred stock dividend obligations. Although it was a drop in the bucket, it shattered the psychological illusion of the “never sell” floor.
- Imbalance between supply and demand: When retail traders, miners, and short-term speculators decide to take profits simultaneously, even a multi-billion-dollar corporate treasury supply cannot accommodate the entire global selling volume on its own.
What’s next for Bitcoin?
The next several daily closes will be pivotal for BTC. If buyers fail to intervene and organize a quick recovery back above the level $72,000 Mark, gravity towards $70,000 You will become irresistible.
Traders should monitor global macroeconomic indicators, upcoming US economic data releases, and identify ETF net flow data on tracking platforms such as CoinMarketCap To gauge whether retail and institutional interest will return to defend the $70,000 baseline.


