
The price of gold fell sharply today after volatile back-and-forth trading for most of the week. Looking at last week and Monday’s trading, rallies have repeatedly stalled near the $4,760 area. This level was technically significant, as it represented the midpoint of the 50% decline from the March high to the March low, while also closely coinciding with the 100-day moving average. The inability to break and stay above these key resistance levels gave sellers the green light to reassert control, resulting in renewed bearish pressure at the start of the trading week.
Initially, the decline found support near the 200 hourly moving average, which helped stabilize the market and slow the decline through most of Tuesday’s trading. However, this support fell yesterday as sellers pushed the price below the moving average with stronger downside momentum. This downward momentum has accelerated further today, with gold currently down about $90, or -1.93%, near $4,560. The low price reached $4,511.54.
More importantly, today’s decline tested a key support area established by the swing lows from late April and early May between $4,500 and $4,512. The session low reached directly into that area, as buyers stepped in to slow the decline. This makes the $4,500 level an important technical gauge going forward. A sustained move below this level would increase the bearish bias and potentially trigger another wave of selling pressure.
On the upside, resistance now appears between $4,600 and $4,610. This area includes the broken 38.2% retracement of the rally from the March low, along with the underside of the previously broken trend line connecting the March lows and early May lows. As long as the price remains below the resistance area, sellers maintain the technical advantage and remain in greater control.
If the $4,500 support level breaks down, traders can start targeting the bullish 200-day moving average near $4,322 as the next major downside target. For now, the sellers are clearly in control, but the market has found at least temporary support near the previous lows in April and May, which has helped slow the recent bearish wave.
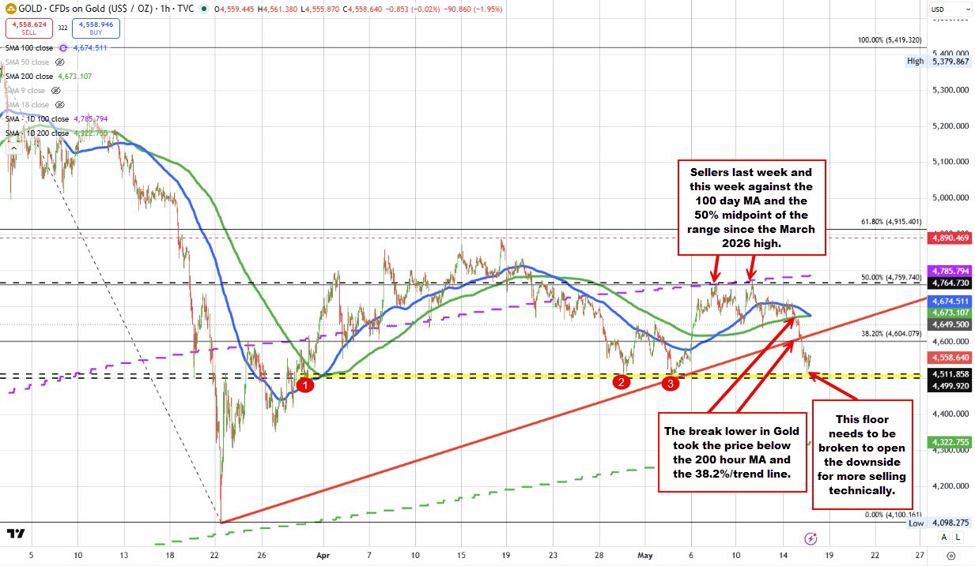
The video above shows trading and technical analysis of the current gold price.


