
The US Dollar Index (DXY) is shooting towards the 101 level after forming a double bottom on the daily chart. Historically, this move could have affected the price of Bitcoin (BTC). But correlation data for 2026 tells a different story.
Bitcoin is trading near $80,605, up 0.97% over 24 hours and 8.71% over the past 30 days. The question now is whether the strength of the dollar is still driving the price of Bitcoin, or whether Bitcoin is moving according to its own fundamentals.
Long-run inverse correlation still carries weight
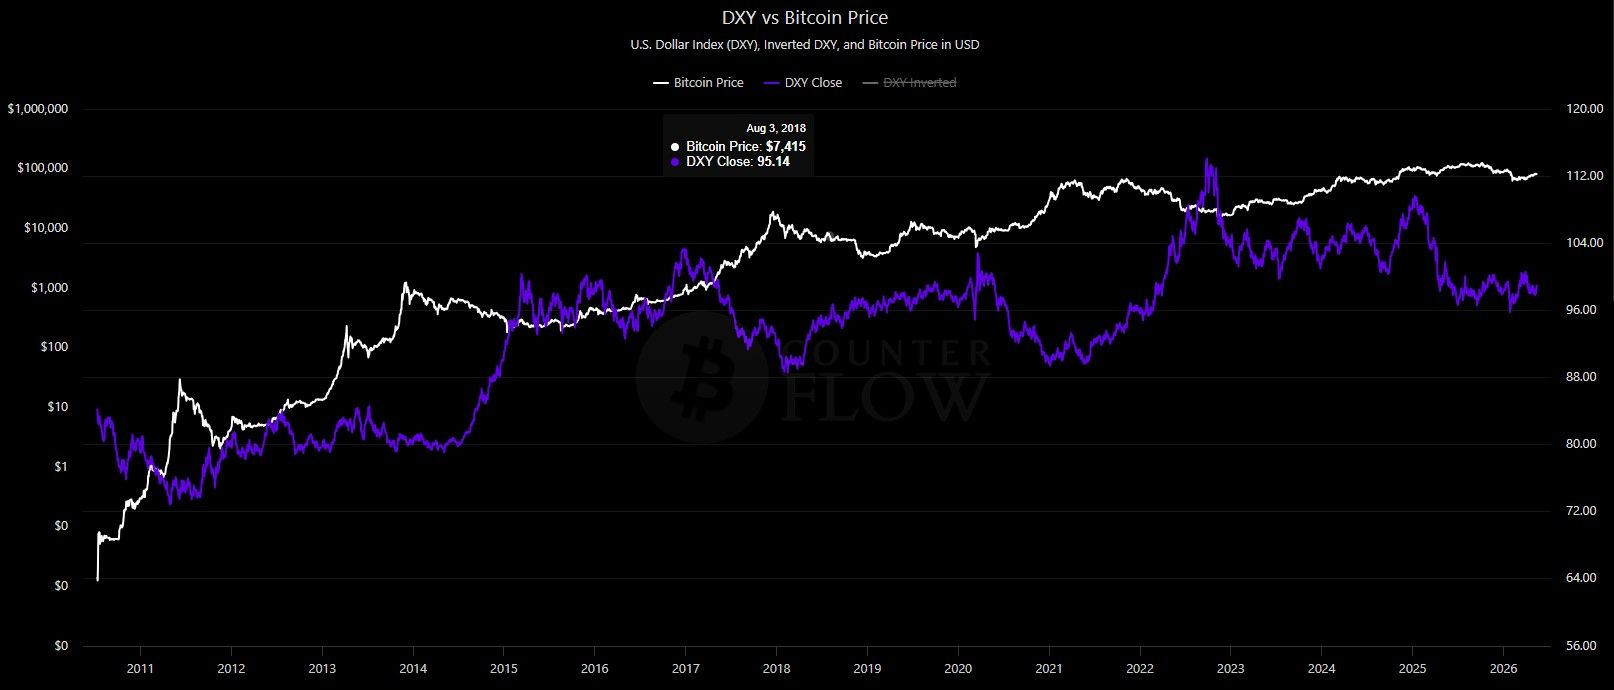
For more than a decade, DXY and Bitcoin in general have moved in the opposite direction Directions. Data from Bitcoin Counterflow goes back to 2011 and clearly depicts the pattern.
Bitcoin’s expansion phases in 2013, 2017, and 2020 were lined up with the DXY index weakening below 90. The DXY spikes in 2014, 2018, and 2022 coincided with significant Bitcoin withdrawals of 60% or more.
The mechanism behind the association is straightforward. A weaker dollar typically signals looser financial conditions and higher risk appetite, both of which have historically lifted Bitcoin along with other risky assets.

YouTuber Karl Moon recently posted a monthly comparison chart that reinforces this view. Its chart represents each Bitcoin halving cycle versus DXY phases.
Red blocks during BTC’s upward movements correspond to DXY’s declines, while green blocks during corrections show dollar strength. However, Moon’s future forecast is pushing both assets higher together, suggesting that the relationship may be changing.
2026 tells a more complex story
While aggregate supply supports the opposite case, recent price action further complicates it. Overlaying the correlation between DXY and Bitcoin on the daily chart shows a mixed picture through 2026.
Late January and early February saw a correlation near positive 1.00 (blue ellipse). Both assets fell together as risk markets repriced. The same positive relationship returned in mid-March and early April, as they both recovered in tandem.
Then the negative correlation returns again from mid-April through May (red ellipse). DXY rose while BTC consolidated near $80,000. The readings approached minus 1.00, confirming the reverse pattern after months of separation.

This saw is consistent with the structural changes in Bitcoin market. Bitcoin exchange-traded fund (ETF) spot inflows reached $1.97 billion in April, the strongest month of 2026.
Institutional demand now affects Bitcoin pricing independently of dollar movements. In contrast, past cycles led by the retail sector reacted more sharply to the strength of the dollar. This sensitivity appears to be fading, as inflows from BlackRock and other issuers stabilize supply.
DXY price prediction points towards 101.075
The current DXY chart makes a clean technical thesis. The price is trading at 99.124 after breaching the 0.618 Fibonacci retracement level at 98.548. The W formation during April and May provides the structural base for this move.
The upside target is at 101.075, roughly 2% above current levels. This level is located just above the 100.393 supply area, which represents the Fibonacci 1.0 extension and the previous March and April high.

Momentum supports breakout. The Relative Strength Index (RSI) has risen towards the 60 level, while the Moving Average Convergence-Divergence (MACD) histogram has turned green and continues to expand.
The invalidation comes at the daily close below the 0.382 Fibonacci level at 97.408. This area is in line with the green support range visible on the chart.
This setting creates a clean test for the broader correlation question. If DXY clears 100.393 and you hold Bitcoin or Paradesthe chapter’s thesis gains weight.
However, if Bitcoin is sold as the dollar index rises to 101, the historical inverse correlation will be reaffirmed, and the macroeconomic situation will become… Troops Still paying in Bitcoin. The next few weeks should answer whether Bitcoin has grown into a stand-alone asset or remains a rider on the path of the dollar.
this post The US Dollar Index is rising: Will Bitcoin price follow or decline? appeared first on BeInCrypto.


