

this post Rising Volatility in XRP Threatens Sellers Near $1.50: Can the Bulls Maintain the Momentum? appeared first on Coinpedia FinTech News
As Bitcoin price now aims to recover above $80,000, the altcoin market is booming once again. As a result, XRP is seeing increased market activity, with short-term traders now betting heavily around the $1.5 area. Additionally, several on-chain indicators are now pointing to a breakout from the current consolidation. If this happens, the price of XRP could be pushed towards the January high.
XRP faces a tough battle below $1.5
XRP has seen extreme volatility over the past few hours. The supply range at $1.5 is creating strong bearish waves, limiting any recovery since Monday. Coinglass data shows that total XRP liquidations have reached $17 million in the past 24 hours. Of this amount, buyers liquidated heavily after encountering resistance above $1.5, worth approximately $10.4 million.
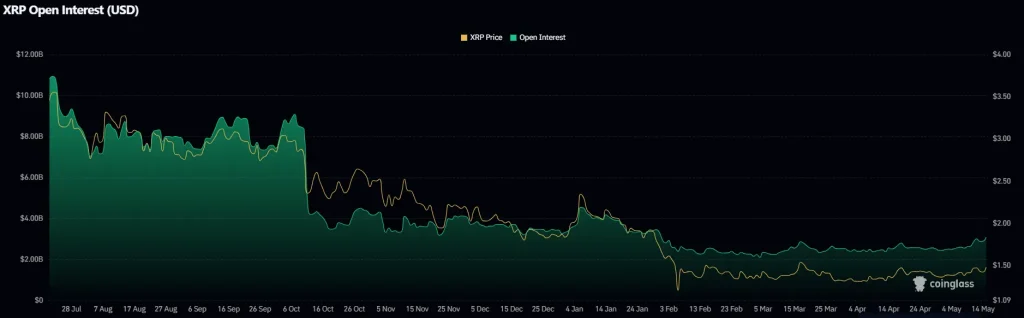
Interestingly, the Senate Banking Committee’s review of the CLARITY Act on May 14 could lead to short-term fluctuations in XRP prices if it strengthens XRP’s status as a commodity. As XRP market volatility rose, it was accompanied by increased open interest. CryptoQuant data shows that open interest for XRP has risen to around $475 million, above the 30-day average of $441 million. Analysts say this indicates stronger investor activity as XRP hovers below $1.5.
Read also: XRP price enters key resistance zone – could a breakout from here lead to a new all-time high?
The proportion of XRP portfolios holding unrealized gains also rose to about 65% on Thursday, compared to 63% the previous day. XRP has also seen strong ETF activity over the past few days.
On Thursday, ETF inflow was around $19 million after a brief slowdown the day before. Interest in these ETFs remained generally strong, with total inflows increasing from $1.36 billion to $1.37 billion. Meanwhile, the total value of assets rose to an average of $1.25 billion, compared to $1.14 billion. It creates strong potential for XRP to charge $2.
What’s next for XRP?
XRP price was hovering within a narrow range after encountering multiple resistances at $1.5. However, it shows that buyers are still holding their positions, expecting the price to rise. As of writing, XRP is trading at $1.4, down over 1.8% over the past 24 hours.
If XRP moves above the downtrend line, the XRP/USDT pair could rise to $1.6. Sellers will likely try hard to stop the price at this level because a move above it could signal the beginning of a new upward trend. If that happens, the price of XRP could rise further towards $2.
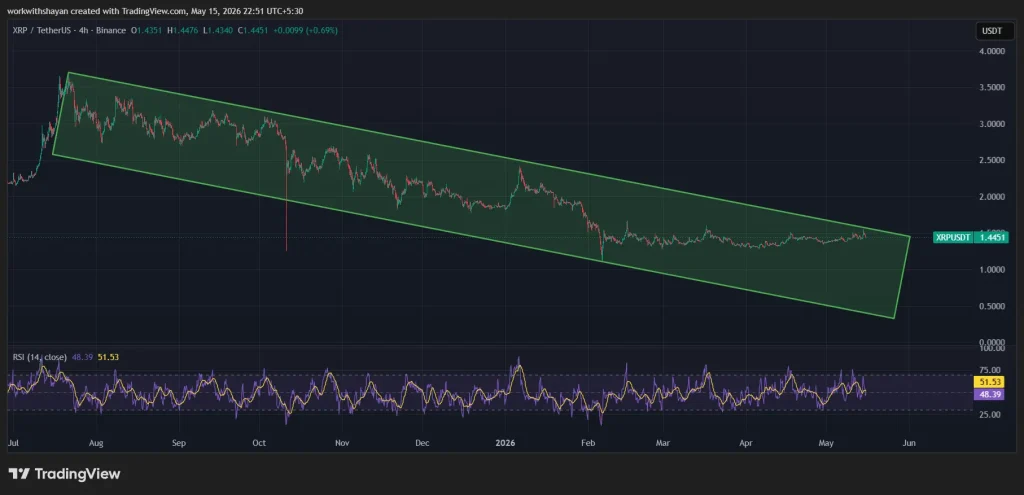
On the other hand, if the price falls below the moving averages, this indicates that buyers are losing confidence. In this case, the price of XRP could drop to around $1.25, where buyers could step in again.
The RSI level is hovering below the midline at level 48. Although it indicates slight bearish control, buyers are actively defending the immediate SMA levels.


