
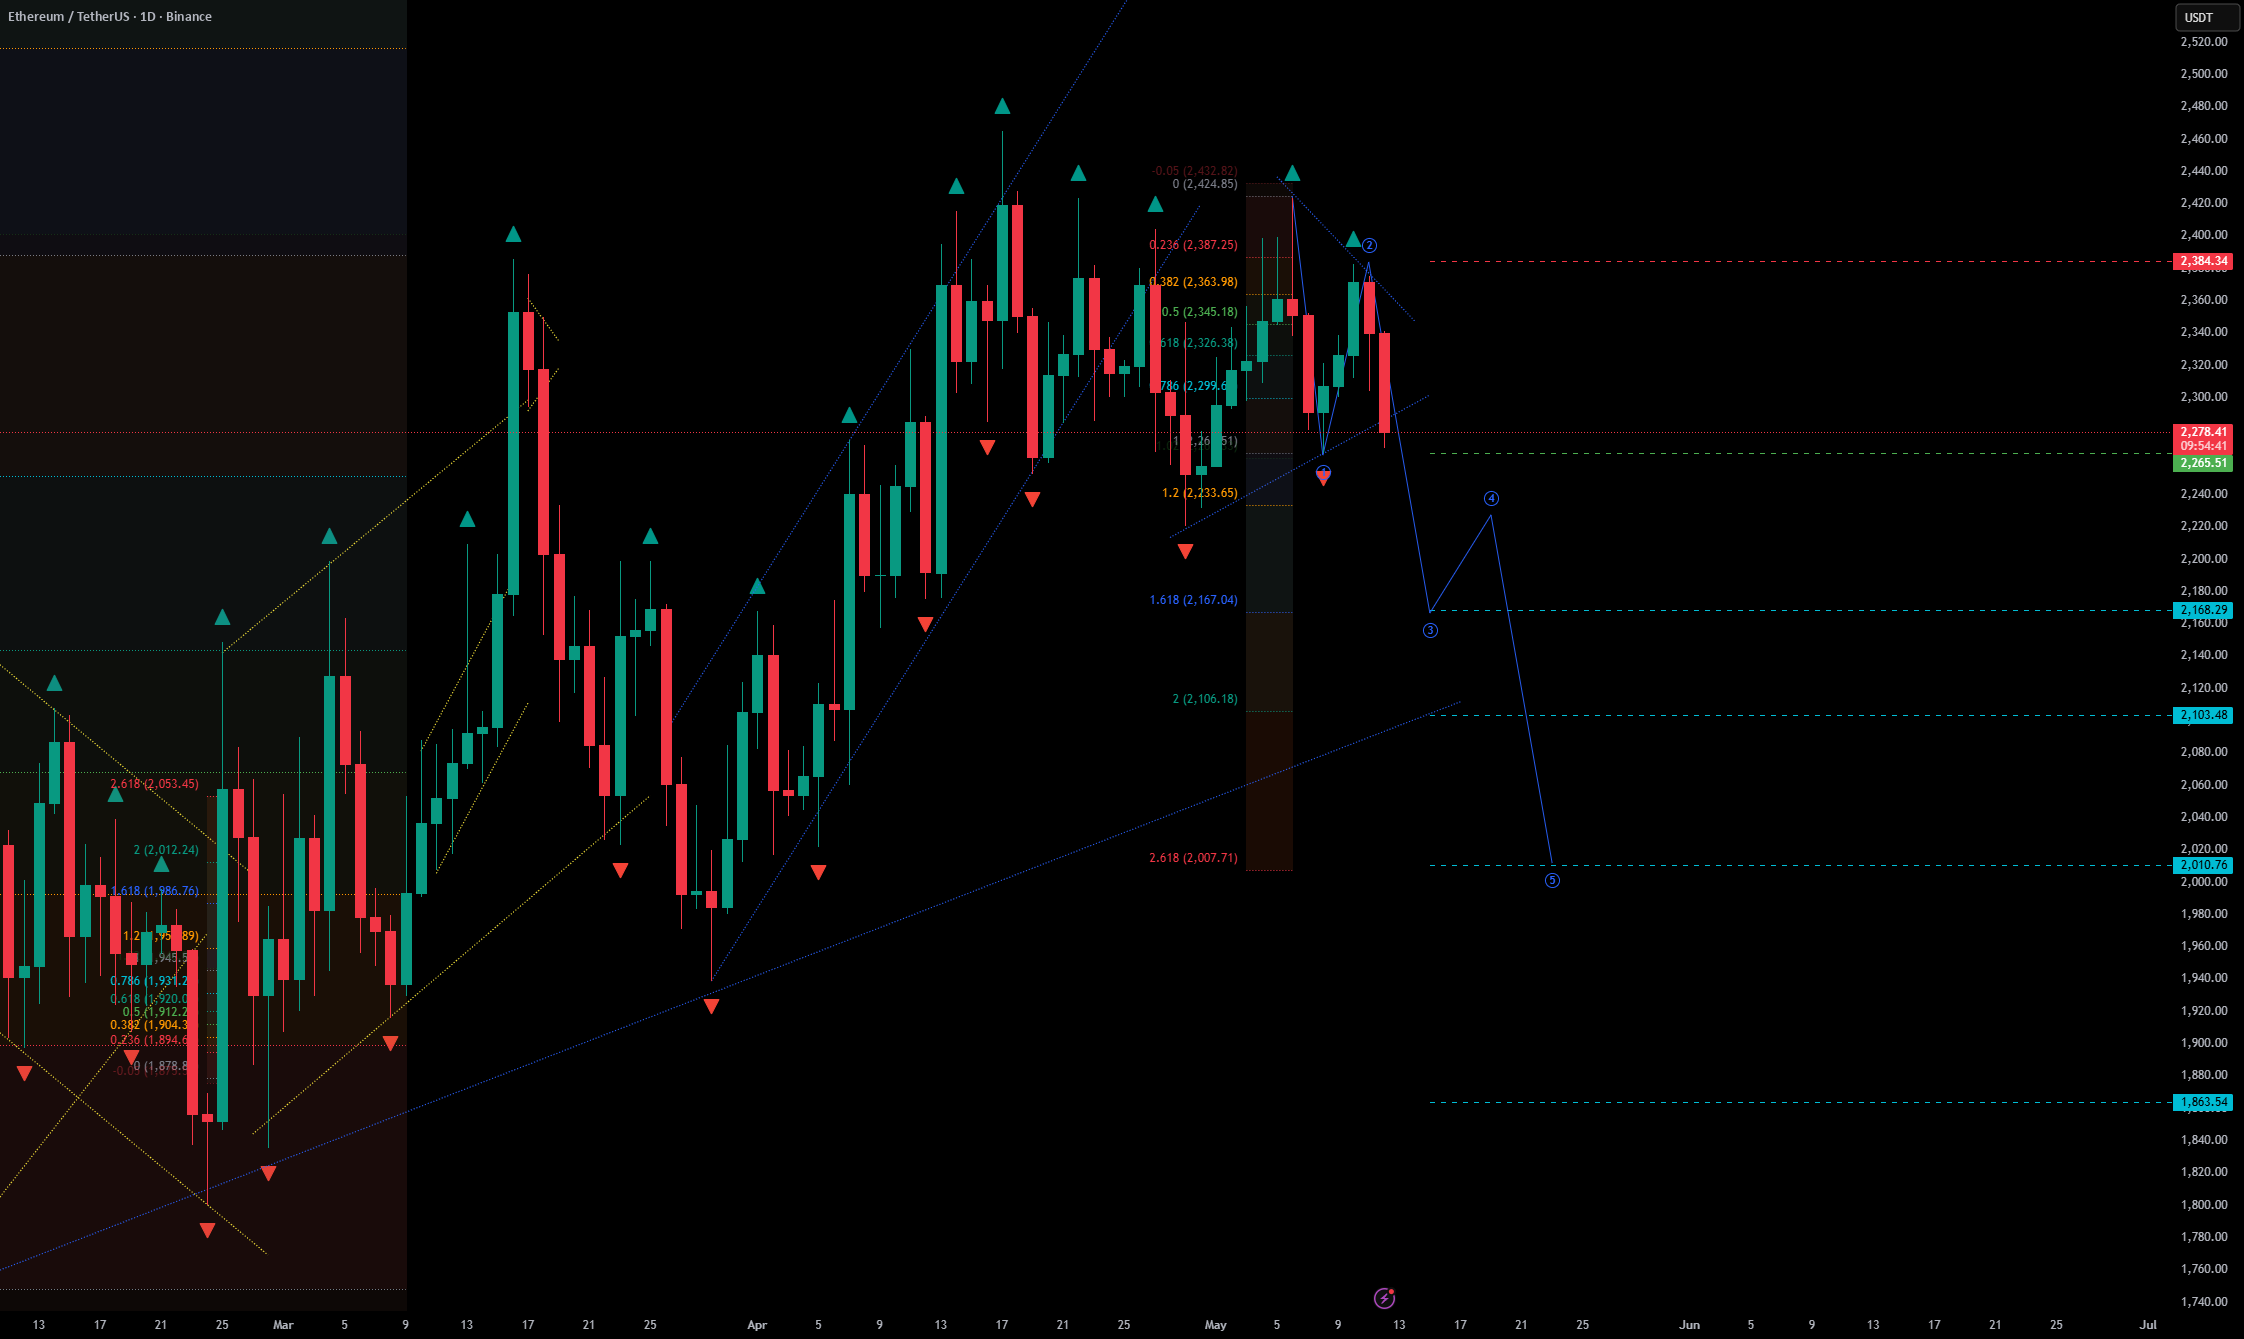
Potential wave 3 formation + trend line breakout
Bearish continuation scenario
🔎 Market Structure — D1
On the daily time frame, ETHUSDT is showing a potential bearish continuation setup after breaking below the local uptrend line.
The price reacted from the top of the structure and failed to maintain the upward momentum, which increases the possibility of the downtrend continuing.
Main technical signals:
Breakdown of the local trend line
Rejection from the corrective high area
Possible correction of wave 2 is completed
Loss of short-term bullish structure
Activate the bearish impulse below the local support area
The current setup is in line with the Elliott Wave continuation pattern, where wave 3 may start after the price breaks out of the corrective structure.
📐 Elliott Wave Context
Wave 1: An initial bearish impulse wave
Wave 2: Corrective bounce towards resistance
Wave 3: Potential active downward expansion
📌Basic principle:
The bearish scenario remains valid as long as ETH remains below the top of wave 2.
A break above this level would invalidate the current downtrend and may signal a shift towards an alternative bullish scenario.
📍 Login
Entry: 2,265.51
The entry is placed:
Below the broken uptrend line
After rejection from the local resistance area
Within the bearish impulse activation zone
With invalidation placed above the top of wave 2
🎯 Target levels – wave 3 forecast
The targets are based on the expected bearish impulse structure and Fibonacci extension areas:
TP1: 2,168.29
TP2: 2,103.48
TP3: 2,010.76
TP4: 1,863.54
Each target represents a potential reaction area where partial profit taking or temporary consolidation may occur during the development of wave 3.
🛑 Invalidate/Stop Loss
Stop loss: 2,384.34
The stop point is placed above the top of wave 2, which:
Protects the setting from being invalidated
It confirms that the bearish wave 3 scenario is no longer valid if it is broken
Keeps risks clearly defined above the corrective high
Avoids premature invalidation within normal market noise
📊 Risk/reward overview
Entry: 2,265.51
Stop: 2,384.34
Risk: about 5.25%
Target potential:
TP1: about 4.29% decline / RR ≈ 0.82
TP2: about 7.15% down / RR ≈ 1.36
TP3: about 11.24% decline / RR ≈ 2.14
TP4: about 17.74% decline / RR ≈ 3.38
🧠 Risk and trading management
This is a bearish trend following setup based on the potential start of wave 3 on the daily time frame.
Recommended management approach:
Monitor the reaction around TP1, as the first target has a lower RR profile
Consider partial profit taking from TP2 onwards
Reduce risks after confirming the continuation of the downtrend
Move your stop to breakeven only after a clear downward impulse appears
Avoid adding to position after extended bearish candles
The measurement should only be taken into account for controlled pullbacks within the wave
📌 Summary
ETHUSDT on D1 is forming a potential bearish continuation setup for wave 3 after breaking the local trend line and rejection from the corrective top.
The bearish scenario remains active below 2,384.34, and bearish targets are located at 2,168.29, 2,103.48, 2,010.76, and 1,863.54.
The setup is invalidated if the price breaks the high of wave 2.


