
I executed a sell trade as a sub-plan based on the current price action, ideally targeting the monthly open, with invalidation above 84K, since reclaiming that resistance would open up the possibility of seeking liquidity for the price around the weekly 50 EMA, where I would then look for another sell setup.
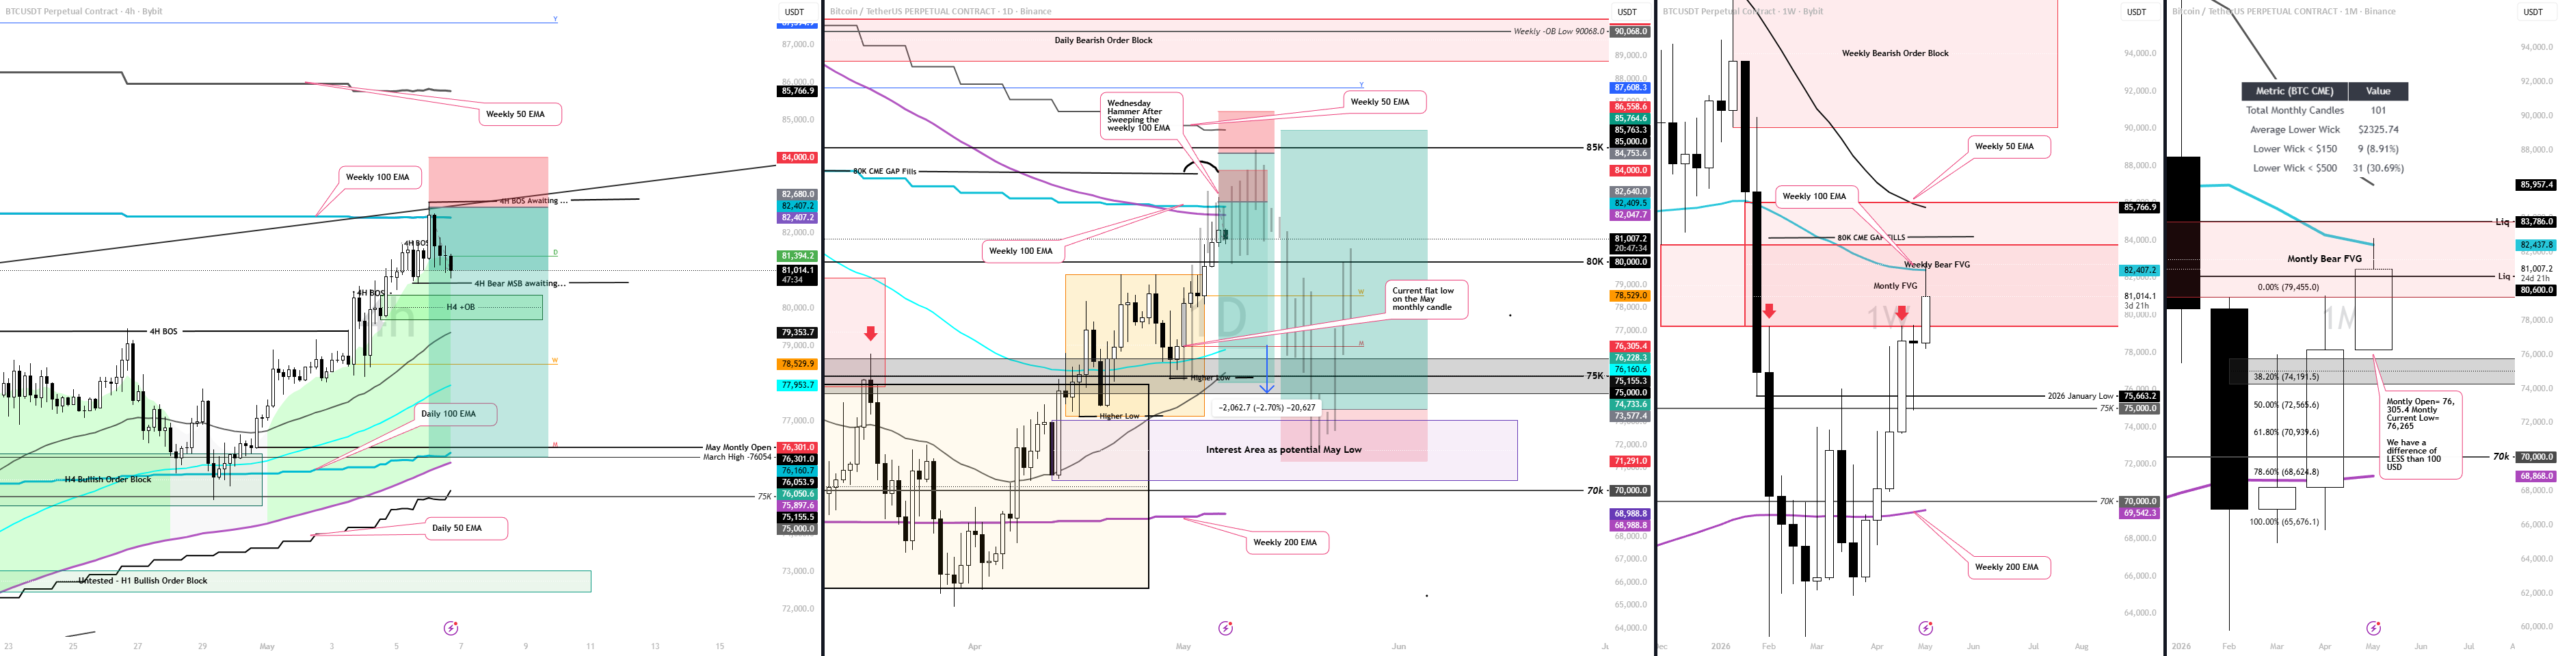
The monthly open is at 76,305.4, while the current monthly low is 76,265.
This leaves a difference of less than $100. Based on monthly CME data, the probability of a daily candle with such a flat bottom, meaning the lower wick is smaller than $150, is only about 9%. The average monthly lower wick length is around 2.3k, which makes targeting the monthly open as a short target statistically reasonable.
Based on the current structure, I’m starting to think about the possibility of forming a shallower monthly bottom, focusing more on seeking liquidity and demand below the monthly open rather than breaking the entire structure and taking out the bottoms of the recent highs.
However, the reaction and daily candle close will be important to assess the amount of actual demand if the price reaches the monthly open soon.


