
Key notes
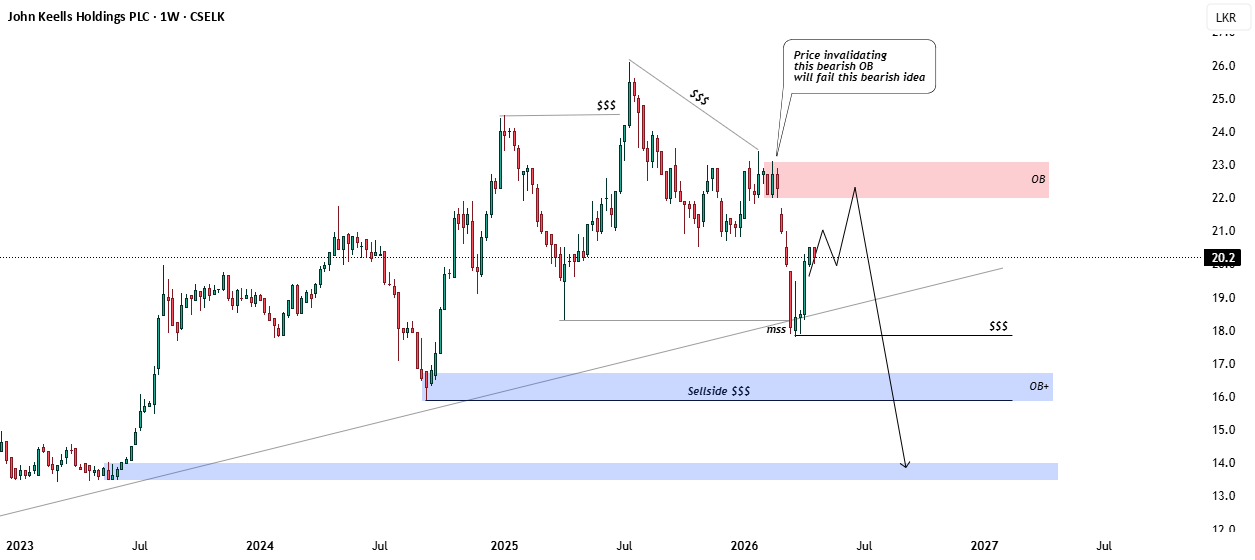
Bearish Order Block (OB): The price encountered significant resistance within the red shaded area (22.0-23.0). This area acts as a bearish supply zone. As mentioned earlier, price invalidation of this OB would fail the bearish thesis, but the recent rejection confirms seller dominance.
Market Structure Shift (MSS): A critical MSS occurred near the 18.5 level, where the price broke out of the previous swing lows. This break in the structure indicates that the long-term trend has shifted from “buying the dips” to “selling the highs”.
Liquidity Gaps and Targets: The chart identifies sell-side liquidity ($$$) located around the 16.0 level. Below that, the OB+ (blue shaded area) near 14.0 remains the main magnet for price action if the current downward trajectory continues.
Expected path: The expected move includes a corrective bounce (retest of the breakdown level) before a continued decline towards lower liquidity pools.
summary
The outlook for JKH is decidedly bearish following the confirmation of the bearish demand block and the subsequent shift in market structure. The trend line that supported the 2023-2025 rally has been broken, and the price is now moving in a “retest and decline” series. While short-term volatility may see a slight move towards 21.0, the technical weight is pointing towards a liquidation event targeting the 16.0 and 14.0 support areas. Traders should watch the 23.0 level to invalidate these bearish expectations.


