
Full analysis on Thursday
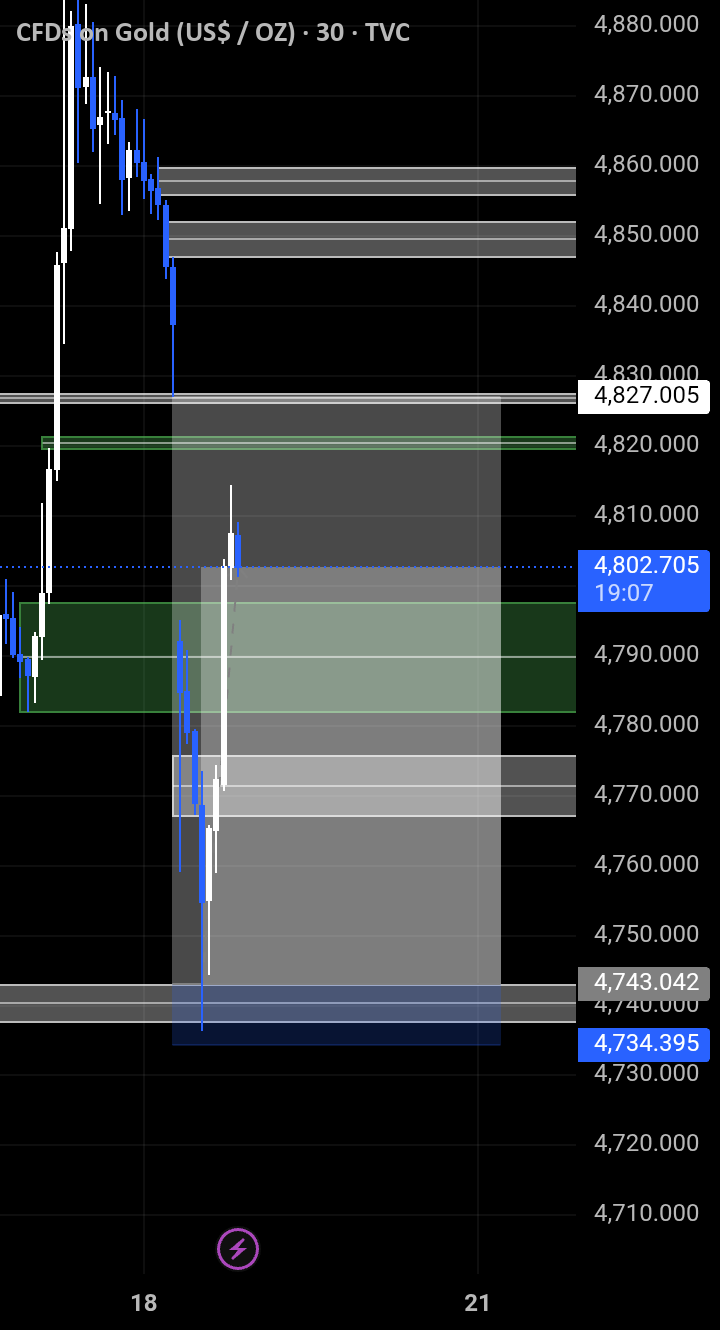
Gold ($/oz) TVC:Gold
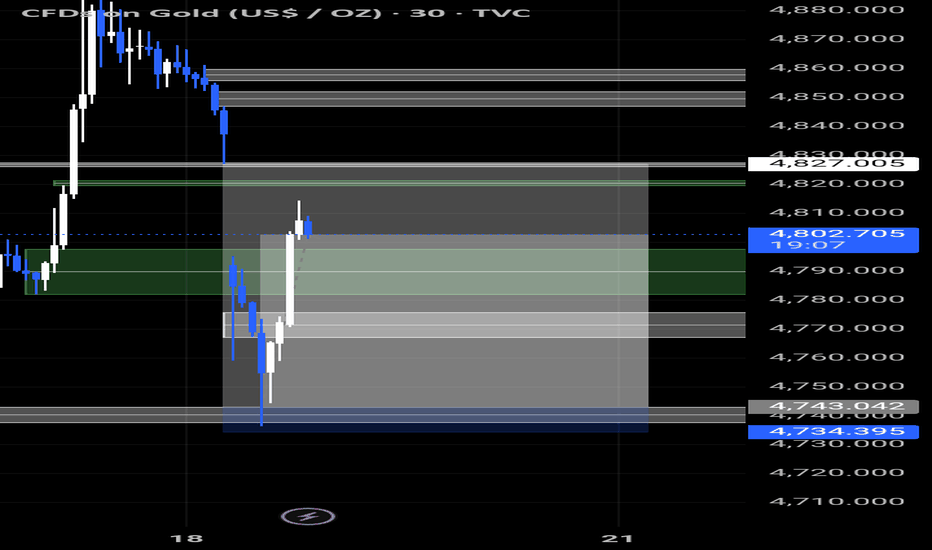
This chart shows a strong downward movement as liquidity has been taken from the sell side and the price has reacted upward, but the current movement is just a pullback, not a confirmed reversal; You entered buy in the middle of the range rather than the true demand zone, which makes it risky because the price is now approaching a key resistance zone around 4820-4830 which it could easily reject and continue lower, so unless the price breaks and stabilizes above this level with a clear higher low, this remains a counter-trend trade and the higher probability setup is either waiting for a deeper entry near the 4740 demand or looking for continued selling from the current supply zone.

