
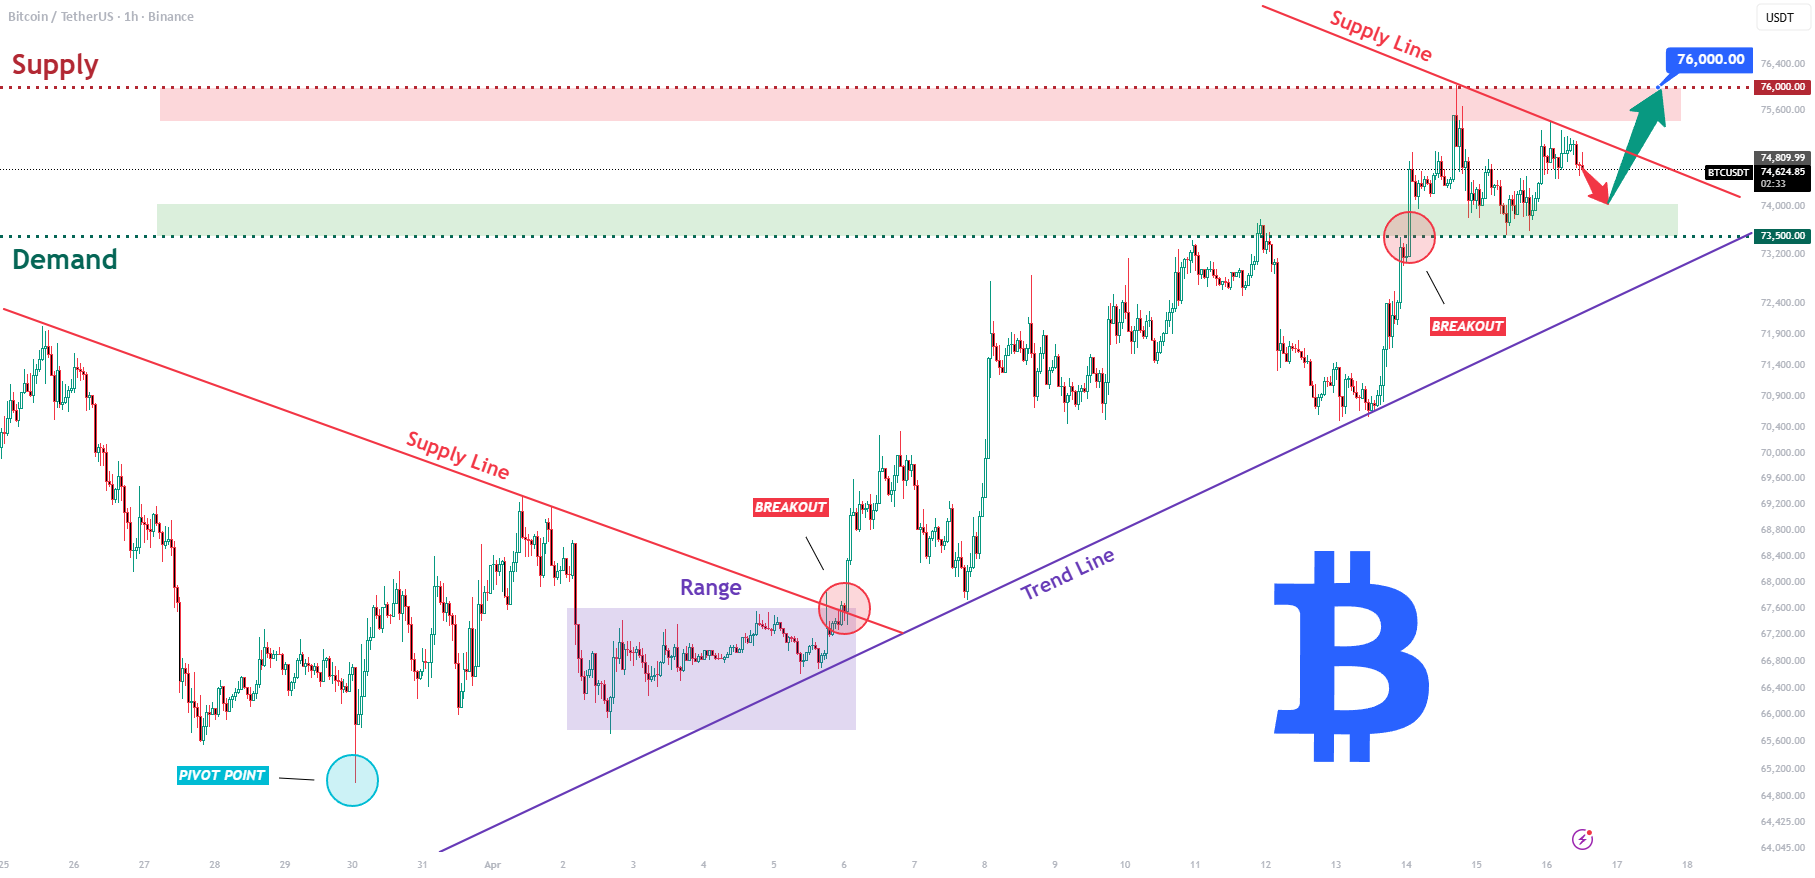
Hello traders! Below are my technical predictions based on the current structure of the BTCUSDT (1-hour) chart. Previously, BTC was moving below the descending resistance line. After the breakout, the price found a pivot point and started the recovery phase. After that, Bitcoin turned into a bullish structure, forming higher lows and indicating upward momentum.
Currently, the price is holding above the 73,500 demand zone, confirming that it is a major support level. Meanwhile, Bitcoin is approaching the 76,000 supply zone, which is in line with the falling supply line and acts as strong resistance.
As long as BTCUSDT price remains above the 73,500 support level and is in line with the uptrend line, the bullish scenario remains valid. A potential retest of support could provide momentum to break the triangle structure and move towards the 76,000 (TP1) resistance level. Manage your risks!


