
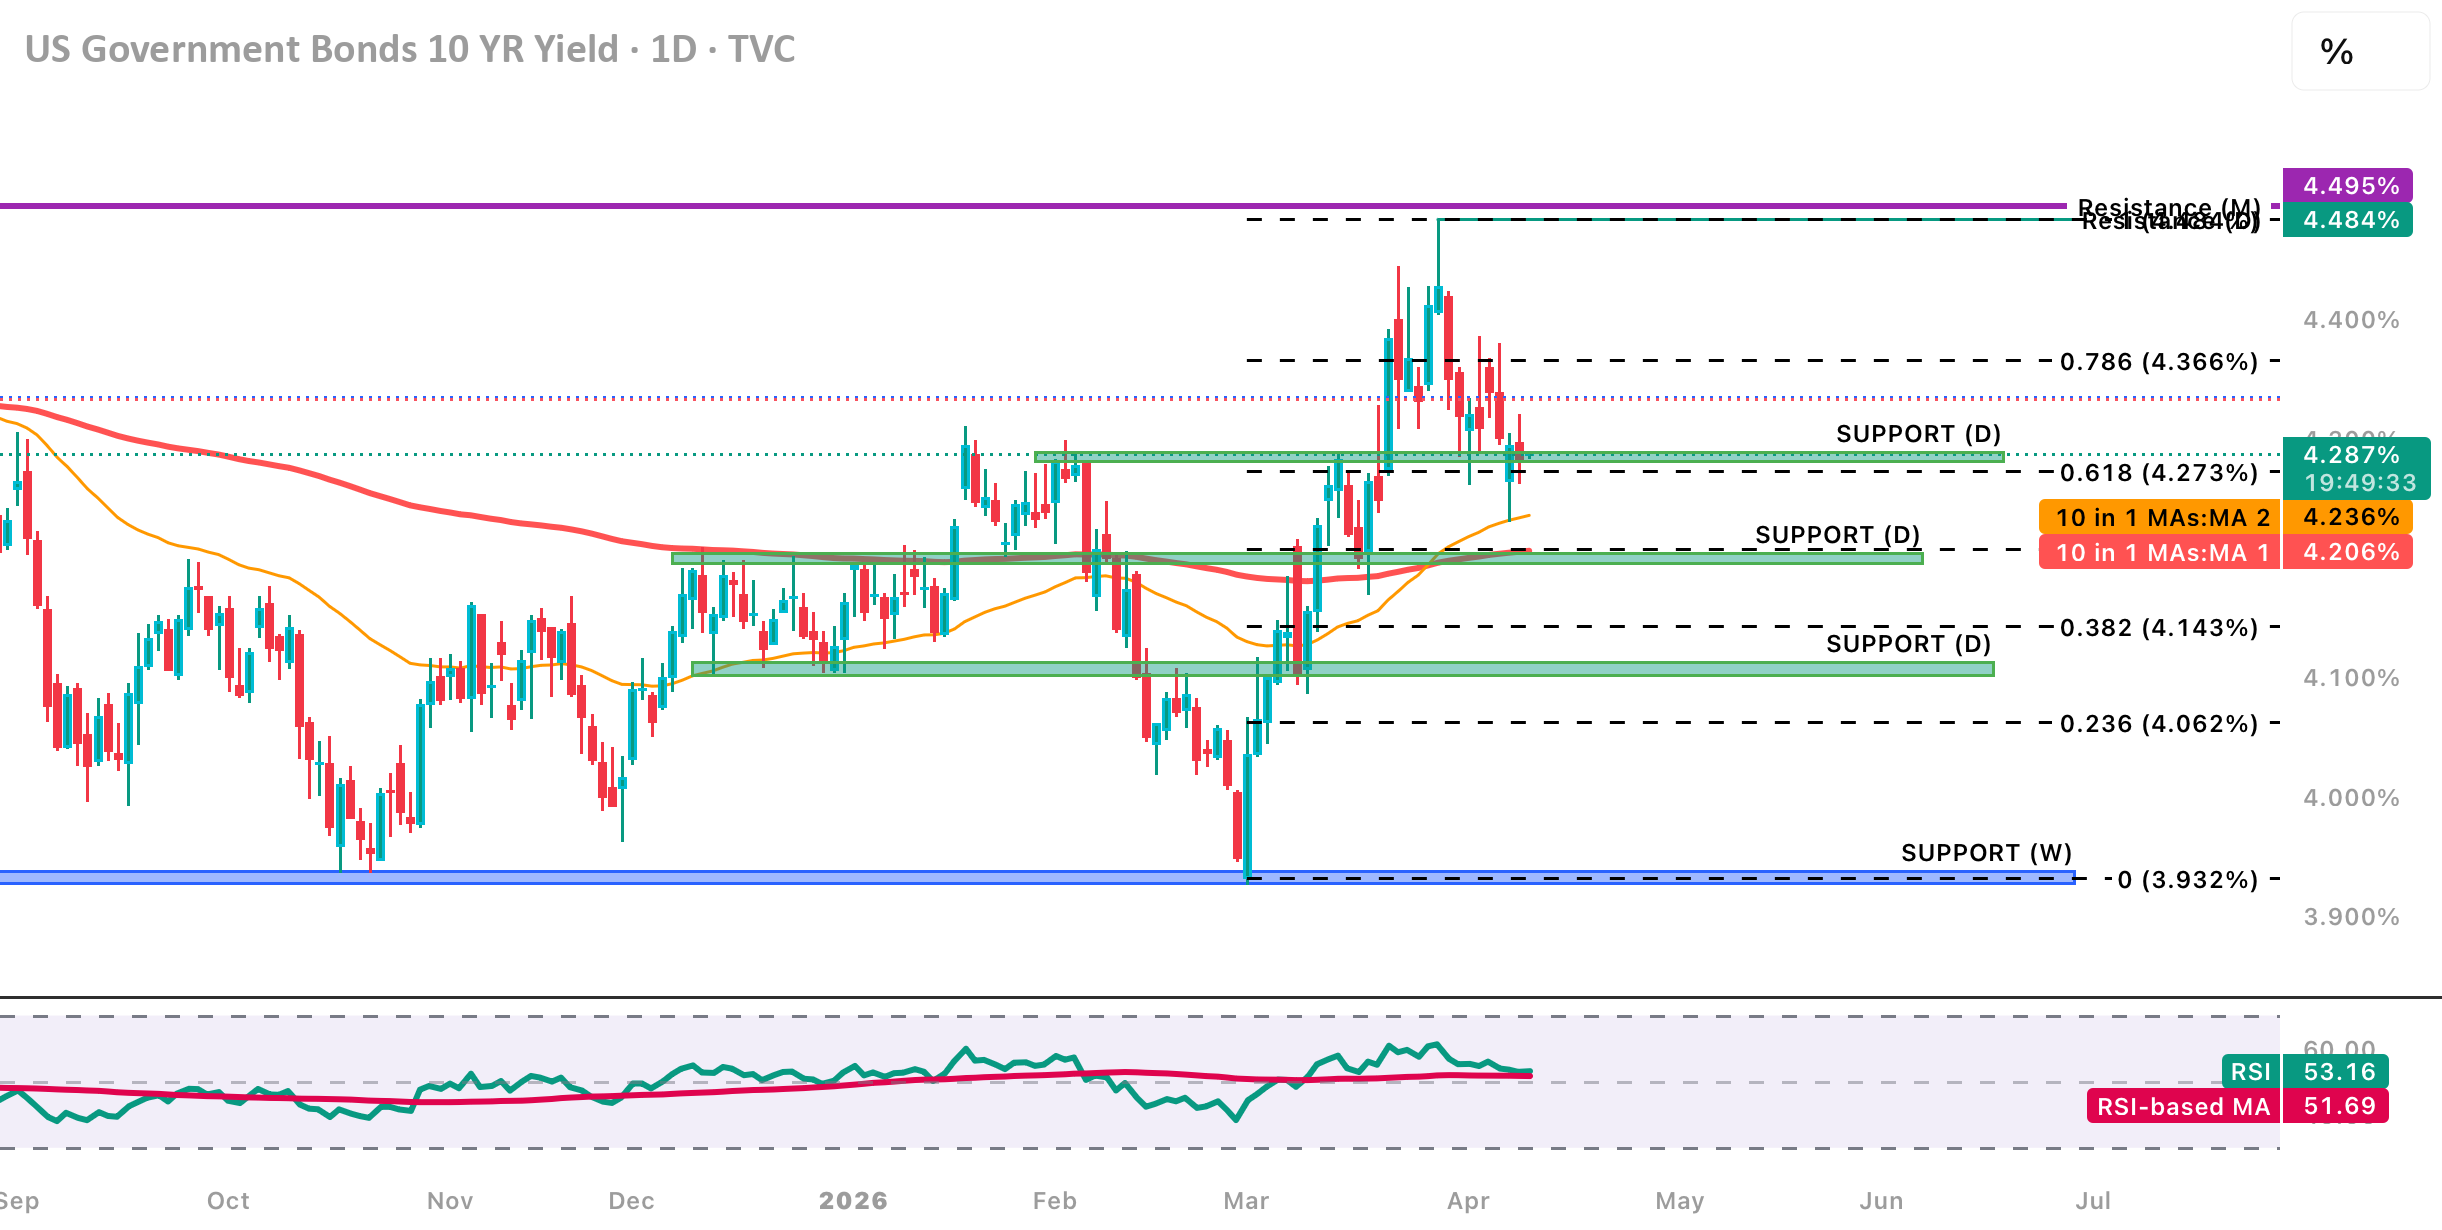
The yield to test monthly resistance rose at 4.495% – 4.484% but fell sharply, now hovering around 4.28% – 4.29%.
Key levels:
• Resistance: still 4.495% (monthly high)
• Support: 4.273% (0.618 Fib daily), 4.143% (0.382 Fib), and strong weekly support at 3.932%.
The price remains above the orange 50 EMA (about 4.23%) and well above the red 200 EMA, maintaining the long-term bullish structure. A pullback looks like a healthy rejection of resistance rather than a trend reversal.
The RSI (28) is near 53, just above the 50 SMA, → Momentum is neutral to slightly bullish, with room to rise before overbought territory. There is no clear trend line visible; It is still trading within the broader range with an upward bias.
Short-Term Bias: Cautiously Bullish. Holding above 4.273% keeps the door open to test another 4.495% level. A break below 4.273% could quickly target the next support group.
What do you think – will the price bounce from here to retest the resistance, or will it fall further to test the 4.27% support level?
Indicator settings: Ema 50 (orange) Ema 200 (red) RSI: period 28; SMA 50 (RSI-SMA crossover detects bullish or bearish momentum)
#US10YR #BondYields #TechnicalAnalysis #SupportAndResistance #TradingSetup


